Performance analysis
F1 22 (2022): what it takes to run it
Measured on 62 gaming laptops at 1920×1080, High preset, upscaling off.

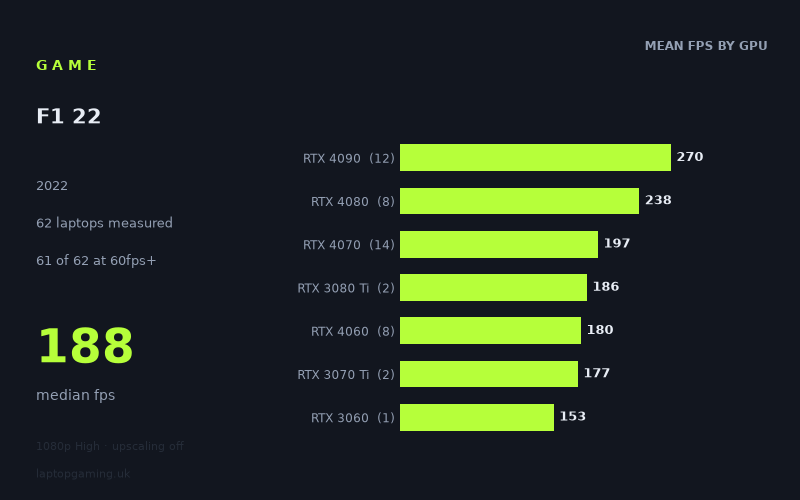
Every laptop we have figures for
Frame rates measured by Notebookcheck.
What it asks of a laptop
At 1,920 x 1,080 on the High preset with upscaling disabled, F1 22 is generally a forgiving game for gaming laptops. Notebookcheck’s measured figures span a substantial 48fps to 318fps across 62 laptops, but the median is a very high 188fps. More importantly for prospective buyers, 61 of the 62 measured systems reached 60fps, 55 reached 100fps and 50 reached 144fps.
That does not mean every laptop produces the same experience. The performance spread is wide, particularly at the lower end, and GPU class as well as laptop power limits still matter. The fastest result, 318fps from the Alienware m18 R1 with an RTX 4090, is more than six times the 48fps recorded by the MSI Prestige 15 with an RTX 3050 Ti. However, the figures show that F1 22 does not require an expensive flagship machine simply to be playable at these settings.
The separation between GPU tiers is clear, but it is not a simple model-number hierarchy. RTX 4090 laptops averaged 270fps across 12 machines, RTX 4080 systems averaged 238fps across eight, and RTX 4070 laptops averaged 197fps across 14. Further down, RTX 4060 laptops averaged 180fps across eight samples, while RTX 4050 models averaged 130fps across eight. These are healthy averages for a 1080p High test.
Power configuration and chassis matter, especially among thinner designs. For example, the RTX 4070 results range from 235fps on the 140W Lenovo Legion Pro 5 to 166fps on the 75W Asus ROG Zephyrus G14 2024. RTX 4060 results range from 217fps on the 115W Lenovo Legion 5 to 146fps on the 50W HP Omen Transcend 14-fb0014. The GPU badge alone therefore cannot tell you the exact frame rate to expect.
What runs it
For 60fps, almost everything in this set is sufficient. The only laptop below that threshold was the MSI Prestige 15 with an RTX 3050 Ti, at 48fps. Even lower-end discrete-GPU machines often cleared 60fps: the Acer Aspire 5 with a 35W RTX 2050 recorded 68fps, while the Lenovo Yoga Slim 7 Pro X 14IAH7 with a 35W RTX 3050 reached 85fps.
RTX 2050 laptops averaged 80fps across two measured systems, although the actual results were 68fps and 93fps. RTX 3050 laptops averaged 99fps across three systems, ranging from 85fps to 110fps. The two RTX 3050 Ti results were much less consistent, at 48fps and 93fps, so that small two-laptop sample should not be treated as a firm rule for every RTX 3050 Ti machine.
For 100fps, an RTX 4050 is usually a sensible starting point in these results. The RTX 4050 average was 130fps, but results range from 94fps on the Acer Swift X and 99fps on the MSI Thin GF63 to 172fps on both the Lenovo LOQ 15IRH8 Core i7 and Lenovo Yoga Pro 9 16IMH9 RTX. Five of the eight measured RTX 4050 laptops exceeded 100fps, while three did not.
An RTX 3060 result of 153fps from the Gigabyte G5 KE clears both 100fps and 144fps, though it is only one laptop and should be read accordingly. RTX 4060 is a stronger proposition for high-refresh 1080p play: its eight-laptop average was 180fps, and every listed RTX 4060 machine was above 144fps, from 146fps to 217fps. The RTX 3070 Ti pair averaged 177fps, with measured results of 173fps and 181fps.
For 144fps, the measured results favour RTX 4060, RTX 4070 and above. All 14 RTX 4070 laptops exceeded 144fps, despite their differing power levels, with results between 166fps and 235fps. The two RTX 3080 Ti laptops averaged 186fps. RTX 4080 systems averaged 238fps, while RTX 4090 machines averaged 270fps. These top-end GPUs provide enormous headroom at the tested settings, but are not necessary purely for smooth F1 22 performance.
The cheapest laptop that handles it
Among the machines with UK pricing in the fact sheet, the Asus V16 at £900 is the cheapest listed option that handles F1 22 comfortably at the measured settings. Its RTX 3050 delivered 102fps, clearing 60fps and just exceeding 100fps.
The next priced step is the Asus ROG Zephyrus G14 2024 at £1,038. Its 75W RTX 4070 recorded 166fps, making it the least expensive priced laptop listed that clearly exceeds 144fps. That is a much stronger result for buyers with a 144Hz display, although it costs £138 more than the Asus V16.
Other priced examples include the Acer Predator Helios 16 with RTX 4060 at £1,869 and 196fps, the MSI Stealth 14 Studio with RTX 4050 at £1,899 and 134fps, and the Alienware m16 R2 with RTX 4070 at £2,393 and 217fps. The numbers do not support paying these higher prices solely for F1 22 if 60fps or 100fps is your target.
What this means if you’re buying
For a laptop bought chiefly to run F1 22 at 1080p High without upscaling, a modest discrete GPU is enough. The £900 Asus V16 demonstrates that 100fps is achievable with an RTX 3050 in the measured sample. Buyers targeting a 60Hz screen have considerable flexibility, including some RTX 2050 and RTX 3050 laptops.
If you want a consistent route to high-refresh performance, the measured RTX 4060 and RTX 4070 results are more reassuring. Every listed RTX 4060 and RTX 4070 laptop reached 144fps, although the RTX 4060 sample ranges by 71fps and the RTX 4070 sample by 69fps. Check the specific laptop’s power configuration rather than assuming two machines with the same GPU will perform alike.
RTX 4080 and RTX 4090 laptops deliver 200fps-plus territory in most of these figures, but their performance is excessive for this particular 1080p High test unless you specifically want the highest possible frame rates. For F1 22 alone, prioritising a well-priced RTX 4060 or RTX 4070 laptop is the more balanced buying approach supported by Notebookcheck’s numbers.
How these numbers were produced
Frame rates here are not measured by us, and we label how each one was arrived at. A figure marked measured comes from a published run on that exact machine. A figure marked representative is derived from the GPU and its power limit (TGP) and cross-referenced against published reviews - a sound estimate of what that configuration delivers, but not a measurement of that specific laptop. Unless stated otherwise, numbers are 1920x1080, High preset, upscaling off. Where a laptop ships in several power configurations we use the wattage of the exact SKU listed, because a 140W RTX 5070 and a 115W one are not the same product.