Review
Asus TUF Gaming A17 review
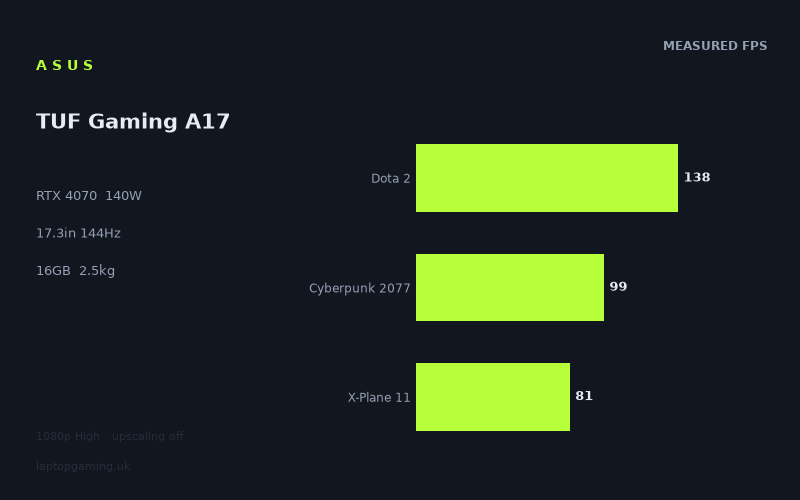
Frame rates
1920×1080, High preset, upscaling off.
Measured on this machine. Source: Notebookcheck, 2024-01-07.
Not scored: incomplete benchmark suite
Every scored laptop on this site is averaged over the same 5 games, and this one is short of Baldur's Gate 3, GTA V. A mean over 3 games is not comparable to a mean over 5, so we publish the figures we have and leave the score blank rather than rank it against machines tested on a different set. The numbers below are real - the suite is just incomplete.
How these numbers were produced
Frame rates here are not measured by us, and we label how each one was arrived at. A figure marked measured comes from a published run on that exact machine. A figure marked representative is derived from the GPU and its power limit (TGP) and cross-referenced against published reviews - a sound estimate of what that configuration delivers, but not a measurement of that specific laptop. Unless stated otherwise, numbers are 1920x1080, High preset, upscaling off. Where a laptop ships in several power configurations we use the wattage of the exact SKU listed, because a 140W RTX 5070 and a 115W one are not the same product.
In use
The short version
The Asus TUF Gaming A17 in this FA707XI-NS94 configuration is a big, deliberately unglamorous 17.3in gaming laptop built around two components that matter more than everything else on its specification list combined: an RTX 4070 configured at a 140W total board power, and a Ryzen 9 7940HS. That power figure is the top of the band a manufacturer is permitted to set for this chip. The same graphics card appears in slimmer machines running at roughly half of it, and the difference between those two implementations is not a rounding error - it is the difference between a card that holds its clocks and one that spends its life being talked down by the cooling system.
The other thing that defines it is a coincidence of specification rarer than it should be: the panel is 1920x1080, and every published frame rate for it was measured at 1920x1080. Most gaming laptop reviews have to hedge, because the benchmark resolution and the native resolution differ and the arithmetic between them is not a simple division. Here there is no gap to hedge across, which makes the A17 a much easier machine to reason about than most of its contemporaries.
Five games were benchmarked at High settings with upscaling switched off, on 7 January 2024. The results run from 210fps in F1 22 down to 81fps in X-Plane 11. Nothing in that list is a struggle. Only F1 22 clears the panel's 144Hz refresh rate outright, and the mean across the three scoring-suite games present is 106fps. That is the shape of a machine sitting comfortably above the point where frame rate stops being a problem, in a generation where the mid-tier cards had genuinely caught up with 1080p.
Two caveats belong at the very front. The first is price: we have no confirmed UK price for this configuration. A gaming laptop is a price-performance product before it is anything else, so no value verdict is available here, favourable or otherwise. The second is the scoring suite. Scored laptops on this site are averaged across the same five games so a ranking means something. This machine has three of them - Dota 2, Cyberpunk 2077 and X-Plane 11 - and we have no figures for Baldur's Gate 3 or GTA V. Averaging three games against a table built on five produces a number that looks comparable and is not, so the A17 stays out of the ranked list.
Who it suits, compressed: someone who plays at 1080p and intends to keep playing at 1080p, who wants the fully fed version of a mid-range 40-series GPU rather than the throttled one, who wants a large screen at a desk, and who is not going to carry a 17.3in machine through a daily commute.
Performance
What 140W buys, and what a TGP figure does not tell you
The RTX 4070 laptop GPU is not a single fixed product. Nvidia specifies a power band, and each manufacturer picks a point in it based on how much heat the chassis can shed and how loud the fans are allowed to get. The resulting spread between the bottom and top of that band is wide enough that two laptops with an identical GPU on the box can be separated by a comfortable margin in every game they run. This machine sits at the ceiling. Nothing about the graphics card is being held back to protect a slim profile.
That is the useful half of the number. The other half is what a TGP figure genuinely cannot tell you, and it is worth being blunt, because power limits get quoted as though they were results. A TGP is a permission, not a promise. It states the maximum sustained power the card is allowed to draw. It does not state that the cooling system can remove that much heat indefinitely, that the card is still drawing it forty minutes into a session rather than five, or that the CPU and GPU are not sharing a budget in which one must give way when the other is busy. Two machines can both advertise 140W and behave quite differently once the chassis warms through, and nothing on a specification sheet separates them.
Only measurement separates them, and we have no thermal or acoustic figures for this machine at all - no temperature under load, no fan noise, no sustained-clock trace. If acoustics under load matter to you, that is a question to settle elsewhere before buying.
What the benchmark data can show is the signature of a GPU that is not being strangled. A power-starved card produces a compressed set of results: it hits its limit early in every title and stays there, so the fast games come in slower than they should and the heavy ones slower still. The measured spread here runs from 210fps to 81fps, roughly two and a half to one across five titles at one resolution and one preset. That is hardware being allowed to run as fast as each game permits, so the differences between titles express the games rather than the thermal design.
F1 22 at 210fps: the only game that clears the panel
F1 22 is the fastest result by a wide margin and the only one that beats the 144Hz display. Racing engines behave this way for structural reasons rather than accidental ones: largely fixed track geometry, a modest number of cars, controlled draw distances, and a genre with a hard commercial requirement for frame consistency because input latency is the whole experience. The result is an unusually tight per-frame budget.
At 210fps against a 144Hz panel the position is unambiguous - the display limits this title, not the graphics card, and a large surplus sits unused. That surplus is spendable on higher presets than the High setting used for the benchmark, on additional effects work, or on an external display with a higher refresh rate. It can equally go on nothing: capping frames near the panel's refresh in a title running this far above it cuts power draw and therefore the heat the fans must shift - a lever worth knowing about on a machine with no published acoustic figures.
The comfortable band: Dota 2 at 138fps, Final Fantasy XV at 122fps
Two titles sit between the panel's refresh rate and 120fps, and they arrive there by opposite routes.
Dota 2 at 138fps is the result most likely to be misread. Dota 2 is not a graphically demanding game by any modern standard, and a 140W RTX 4070 is not being stretched by it in any rendering sense. A figure of 138fps therefore sits far below what this card can draw, which means the frame time is being set somewhere other than the GPU - by the game's own simulation work, its draw-call submission pattern, and the single-thread throughput available to service both. This is a CPU-bound and driver-overhead-bound result, and it is one of the three scoring-suite games present, so it carries real weight in how the machine would be ranked if the suite were complete.
For a competitive player the practical reading matters. An average of 138fps against a 144Hz panel means the game spends much of its time at or near the display's ceiling with dips below during busier moments. It also means the usual remedy fails: turning settings down in Dota 2 buys very little, because the graphics card was never the constraint. More frames in this title means a faster processor, not a bigger GPU.
Final Fantasy XV at 122fps is the opposite case - an expensive renderer with heavy post-processing and a well-earned reputation for effects work that costs genuine GPU time. It lands exactly where a GPU-bound title of its era should land on this hardware. Nothing about the number is pathological; it is the graphics card doing the work and reporting honestly, and 122fps against a 144Hz panel is a shortfall small enough to be academic in a single-player game.
Together these two are the clearest demonstration in the set of why a single headline frame rate is close to useless. They are sixteen frames apart and limited by completely different parts of the machine, and they respond to completely different upgrades.
Cyberpunk 2077 at 99fps: the game that works the GPU
Cyberpunk 2077 is the heaviest modern renderer in the measured set and the title that best justifies a 140W card rather than a cheaper one. 99fps at 1920x1080, High preset, upscaling off, is a strong showing for a mid-tier 40-series machine, and it needs judging against its own generation rather than against later hardware. When these figures were recorded in early 2024, Cyberpunk was still the standard stress test for laptop graphics, and clearing 90fps at native 1080p without leaning on DLSS marked a properly configured mid-range machine rather than a token one.
It also shows where the headroom is. At 99fps native, in a title with strong upscaling support, the practical experience on the panel this laptop actually has is well clear of any concern about smoothness. One qualification: the data records the preset as High with upscaling off and does not record whether ray tracing was involved, so the safe reading is the standard raster result at that preset. We have no ray-tracing figures for this machine.
This is the result that would suffer most from a lower-power version of the same chip. Where the GPU is saturated, sustained clocks are worth real frames. The 140W configuration earns its keep here in a way it emphatically does not in F1 22, where nothing is limited by the graphics card at all.
X-Plane 11 at 81fps: slow for the opposite reason
X-Plane 11 is the slowest result and the one barely about the graphics card. It is a flight simulator with an older-generation renderer that issues an enormous number of individual draw calls per frame, each of which the processor must prepare and push through the driver before the GPU sees any of it. That is a textbook CPU-bound, API-overhead-bound workload. A faster graphics card produces very little here; faster single-thread CPU performance produces a great deal.
This is why 81fps sitting below Cyberpunk's 99fps is not a contradiction, and why reading the benchmark list as a difficulty ranking would mislead you. Cyberpunk is slow because the graphics card is saturated. X-Plane is slow because the graphics card is waiting. The two bottom results come from opposite failures and their fixes point in opposite directions.
It matters commercially because X-Plane is the third scoring-suite game present, which means a third of the ranking evidence available for this machine measures its processor rather than its GPU. If your own library leans towards simulators, strategy titles or older engines with heavy draw-call counts, that is the result to weight most heavily.
The Ryzen 9 7940HS, and where it shows up
The processor is a Ryzen 9 7940HS, a Zen 4 part and the more capable end of AMD's mobile line for that generation. In GPU-bound titles a chip of this class is close to invisible in the results, because it is not setting the pace. In CPU-bound titles it is precisely what sets the pace, and two of the five measured games fall into that category.
Read the data with that lens and the split is fairly even. F1 22 at 210fps, Dota 2 at 138fps and X-Plane 11 at 81fps are the three results least determined by the RTX 4070 and most determined by what feeds it. Final Fantasy XV at 122fps and Cyberpunk at 99fps are where the graphics card genuinely does the work. That balance is the point: pairing a high-tier mobile CPU with a fully powered mid-tier GPU is a sensible configuration for a 1080p machine specifically because so much of a typical library at that resolution is processor-limited. A cheaper CPU behind the same graphics card would show up exactly where this one currently looks strong. We have no comparative CPU measurements to size that effect, so it is a directional argument rather than a numerical one - but it is the right way to read the top and bottom of this table.
The spread, the test conditions, and why there is no rank
210fps at the top, 81fps at the bottom, across five games at one resolution and one preset. That spread is a property of the games rather than the laptop - all five ran under identical conditions, and the differences between them are differences in what each engine asks for.
The mean across the three scoring-suite games is 106fps, and that figure deserves suspicion despite being arithmetically correct. No game in this list behaves like 106fps. The three it averages are 138fps, 99fps and 81fps, limited by three different things, and anyone who reads the mean and pictures a machine delivering roughly that in everything has the wrong mental model. Five games is also a thin set, three of them processor-influenced, describing a narrow slice of the software landscape; the conclusions here are sound for these titles, and extending them to a library that looks nothing like this list is an extrapolation.
Three conditions shape every figure quoted. Upscaling is off, so these are native-rendering numbers and a floor rather than a ceiling for a real session in DLSS-supporting titles. The preset is High, not maximum - identical across every machine in the database, which is what makes comparison valid, but not the top setting in most of these games. And these are averages: no 1% low figures, no frame-time data, and two laptops with matching averages can feel quite different if one stutters. The figures also carry a date - measured on 7 January 2024, they are a snapshot, and while the relative picture of which titles are fast is durable, the exact digits are less so.
The missing suite games deserve more than a footnote. The temptation is to average the three present and place the machine anyway, and that would be wrong in a way that matters. The five suite games sit at very different points on the CPU-bound to GPU-bound axis, so dropping two changes the character of the average as well as its value. A partial average flatters or punishes depending entirely on which titles are absent, and the resulting table position would carry a false authority.
The screen
1080p panel, 1080p data
The display is a 17.3in IPS panel at 1920x1080 running at 144Hz, and its most valuable property to anyone working out what this laptop will do is that it matches the resolution at which every published frame rate was recorded. That sounds trivial and is not. Many gaming laptops of this generation shipped with 1440p-class panels while being benchmarked at 1080p, leaving a review to reason across a resolution gap that does not scale linearly - because the cost of extra pixels depends on how much of a frame's time goes on pixel work rather than geometry, simulation and CPU preparation. None of that applies here. The 210fps in F1 22, the 99fps in Cyberpunk and the 81fps in X-Plane are the numbers this panel is fed.
The trade-off is the expected one. 1920x1080 spread across a 17.3in diagonal is a lower pixel density than the same count on a 15.6in or 16-inch panel, so individual pixels are physically larger. At normal desk distance that shows as slightly softer text and more visible stair-stepping on high-contrast edges in games with weak anti-aliasing. It is geometry, not a defect. The compensating benefit is that the graphics card never has to fight the display, which is exactly why the frame rates here look as comfortable as they do. 1920x1080 is also 16:9, a shape already being displaced by 16:10 panels by 2024, though on a 17.3in machine the absolute height is generous either way.
144Hz, IPS, and the figures we do not have
Of the five measured games, exactly one exceeds 144fps: F1 22 at 210fps. Dota 2 at 138fps falls six frames short, close enough that the distinction is imperceptible. Final Fantasy XV at 122fps, Cyberpunk at 99fps and X-Plane at 81fps sit below, in one case well below.
That is a sensible pairing rather than a disappointing one. A 144Hz panel is not a promise that every title reaches it; it exists so the games where high frame rates genuinely matter - competitive titles, racing, anything where input latency is part of the skill - are not artificially capped. On this machine the two titles closest to that description are precisely the two that reach or nearly reach the refresh rate. The heavy single-player games sit between 81fps and 122fps, far above the point where a high-refresh display stops helping: a game at 99fps on a 144Hz panel looks materially smoother than the same game at 99fps on a 60Hz one, because it is not forced into a cadence it does not match.
The panel type is IPS, which brings wide, stable viewing angles and generally sensible colour behaviour against the TN panels that used to dominate cheaper gaming machines, at the cost of the contrast an OLED would give. Beyond type, resolution and refresh, we have no measured figures for this display - no brightness, no colour-gamut coverage, no contrast ratio, no response time, and no confirmation of whether adaptive sync is present. That last omission matters a great deal between 81fps and 138fps, where a variable-refresh panel and a fixed one behave noticeably differently. Panel quality varies substantially between configurations of the same model, and a dim screen and a bright one carry the same "17.3in IPS 144Hz" label.
What can be said is that GPU and display are coherently matched. A 140W RTX 4070 driving 1080p at 144Hz is strong enough that the slowest measured game still lands at 81fps, not so overpowered that the resolution wastes it, and with genuine surplus in the lighter titles to spend on settings. Plenty of laptops of this era got that relationship wrong in one direction or the other.
Build, size and portability
The stated weight is 2.51kg and the battery is 90Wh. Those two figures, plus the 17.3in diagonal, describe how this machine gets used more precisely than any amount of chassis description could.
2.51kg is not light in absolute terms, but for a 17.3in gaming laptop it sits at the more restrained end of the range - the genuinely heavy machines in this class run well past 3kg. That suggests a chassis which has not been over-built, consistent with the TUF line's functional rather than luxurious positioning. It does not make this portable, and the reason is footprint rather than mass. A 17.3in laptop is physically large in a way that constrains where it can go: it does not fit many bags designed around 15-inch machines, it is awkward on a train tray table, and inconvenient anywhere desk space is contested. Add the adapter that a 140W graphics card and a Ryzen 9 together require - we have no figure for its weight, but a machine drawing this much under load needs a brick sized to match - and the travelling load is higher again than the specification implies. The honest description is a machine that lives on a desk and moves occasionally: between rooms, to a friend's house, home at the end of term. Buying it as a daily commuting laptop would be a mistake regardless of how good the frame rates are.
The 90Wh battery sits near the practical ceiling, because airline rules cap cabin-carried cells at 100Wh without special arrangement, so manufacturers take as much as they sensibly can and stop just below. We have no measured battery-life figure for this machine, in gaming or in light use. What can be said is a general truth about the hardware class: a 140W graphics card cannot be fed from a battery. No gaming laptop in this bracket runs at full performance unplugged, because the cell cannot supply the current and the firmware will not attempt it. Every figure quoted in this review was recorded on mains power. The 90Wh cell is there for browsing, documents and video away from a socket, and for that it is a useful size.
Memory is 16GB - the mainstream figure for this generation, still adequate, but the specification most likely to feel constrained first over a multi-year ownership period as recent titles grow hungrier on the system side as well as the graphics side. Whether this configuration permits a memory upgrade is not something we have confirmed, and no storage capacity is recorded in our data for it either, so both are worth establishing from the seller's listing rather than assuming.
How it compares
Four machines from the same GPU generation share enough measured games with the A17 for a like-for-like comparison, chosen as a spread rather than a huddle: the two that land closest, the one this machine beats by the widest margin, and the one that beats it by the widest margin. Each comparison uses only the titles both machines hold - four in every case, drawn from the five measured here - and none of the four rivals has a confirmed UK price, so none of these can be resolved on cost.
Acer Swift X, RTX 4050 - the clearest win in the set
Across four shared games the A17 averages 45fps more than the Swift X, the largest positive gap here and a straightforwardly real one.
Two things produce it. The first is tier: the RTX 4050 is a materially smaller card than the 4070, with fewer shader resources and a narrower memory configuration, and no test conditions close that. The second is class of machine - the Swift X is a thin, creator-oriented laptop rather than a gaming chassis, so its graphics card runs at whatever power a slim shell can cool, a long way below the 140W this machine works at. Those disadvantages compound: a smaller chip at reduced power against a bigger chip at its maximum is about the widest gap you can construct inside one GPU generation without jumping to the flagship parts.
The useful detail is that a 45fps average survives the compression 1080p testing imposes. Some of the four shared titles will have been processor-limited on both machines, and in those the two land close together regardless of graphics hardware. For the four-game average still to come out 45fps ahead, the gap in the GPU-limited titles must be considerably larger than 45fps. The average understates the difference rather than inflating it, which is the opposite of how these comparisons usually mislead.
Dell G15, RTX 4060 - the same average, for reasons worth unpicking
Against the Dell G15 across four shared games, the two come out at the same average - not nearly the same, the same, to the frame.
First, an average of zero is not two machines behaving identically. An average conceals offsetting differences: one laptop ahead in a couple of titles and behind in the others produces exactly this figure, and with only four games a single result moving either way shifts it substantially.
Second, and more important, is what 1080p testing does to a comparison like this. Three of the five games measured on this machine are meaningfully processor-influenced - F1 22 far above the panel, Dota 2 at a frame rate no 40-series GPU would struggle to produce, and X-Plane 11 with its draw-call-heavy renderer. If the four shared titles skew that way, then for most of the comparison neither graphics card is setting the pace, and a genuine hardware difference between a 4060 and a 140W 4070 has nowhere to express itself. That difference has not vanished; it is masked by the test conditions, and it would reappear at a higher resolution where the pixel workload rises sharply and the GPU becomes the constraint again, or in a title heavier than any of the four shared here. The correct conclusion is not that these machines are equivalent - it is that on four lightly loaded 1080p titles both cards had capacity to spare, so the measurement cannot separate them.
Acer Predator Helios 16, RTX 4060 at 140W - the level result that actually informs
The Helios 16 also lands on the same four-game average, and here the explanation is different and more interesting, because the Helios is not a compromised machine. Its RTX 4060 runs at 140W - the same ceiling as the card in the A17 - in a large gaming chassis built to sustain it.
This is the comparison that undermines shopping by model number. A fully fed 4060 in a machine with the cooling to keep it fed is a far stronger proposition than the tier gap on paper implies, and the distance between a well-powered 4060 and a well-powered 4070 is considerably smaller than the distance between two 4070s configured at opposite ends of their power band. On this evidence the power limit does more work than the tier badge. The A17's advantage is genuine at the silicon level, but narrower than the numbering suggests, and across four 1080p titles it does not surface in the average at all. If these two ever appear side by side at different prices - hypothetical, since neither has a confirmed UK price - the measured evidence would not support a large premium for the 4070 badge alone. That case has to rest on heavier titles and higher resolutions the shared set does not reach: reasonable, but unmeasured.
Asus ROG Strix Scar 17, RTX 4090 - the machine that beats it, by a lot
Across four shared games the A17 averages 80fps behind the ROG Strix Scar 17, the largest gap in this set by a wide margin and one pointing in the uncomfortable direction.
Apply the Swift X reasoning in reverse. Because 1080p testing compresses genuine hardware differences - some shared titles will be processor-limited on both machines, landing them close together regardless - an average deficit this size cannot be an artefact of the conditions. It has to mean that in the shared titles where the graphics card does set the pace, the Scar is ahead by considerably more than 80fps. The compression works against the gap and the gap is still enormous.
One qualification, stated plainly. The recorded power figure for the Scar's RTX 4090 in our data is 25W, which is not a plausible sustained configuration for that chip in a machine producing these results. It looks like a database artefact rather than a real specification and should not be quoted as a meaningful comparison of power limits. The frame-rate difference is not in doubt - it comes from the same measured source as everything else here. The A17 is not competing with this machine and was never configured to; what the pairing establishes is the ceiling of the generation, and how far a fully powered mid-tier card sits below it once games stop being limited by anything else.
What the four comparisons add up to
The pattern is coherent. Against a smaller GPU in a thin chassis, this machine wins decisively. Against two well-configured 4060 laptops it cannot be separated across four shared 1080p titles, for two different reasons - the G15 because the shared set does not load the graphics card hard enough to reveal a difference, the Helios because a 4060 at the same 140W ceiling is genuinely close to a 4070 at that ceiling. Against the flagship it loses heavily, by a margin the test conditions understate.
The lesson for a buyer is that at 1080p, once a graphics card is fast enough to render the resolution comfortably, adding more graphics card returns steadily less until you jump to a genuinely different class of silicon. The step down to the 4050 is large. The step to the 4060 machines is invisible in the data available. The step up to the 4090 machine is very large. That is not a smooth curve, and knowing where the steps sit is the most useful thing these comparisons reveal.
Who it's for
The committed 1080p player. The panel is 1920x1080, the measurements are 1920x1080, and the slowest of five results is 81fps. No title in that list gives a poor experience and there is no resolution gap to reason across. If 1080p is where you play and intend to keep playing, this hardware has more capability than the resolution demands.
The buyer who wants the fully powered version of a mid-tier GPU. Two laptops advertising an RTX 4070 can be separated by a wide margin depending on the power the chassis permits, and this one sits at the ceiling of that band. If you have been comparing 4070 machines and wondering why identical-looking specifications carry different prices, this is one of the reasons, and this configuration is on the right side of it.
Someone whose library mixes heavy single-player titles with CPU-bound ones. The Ryzen 9 7940HS behind a 140W RTX 4070 is unusually well balanced for 1080p. Cyberpunk at 99fps shows the graphics card doing real work; Dota 2 at 138fps and F1 22 at 210fps show the processor keeping up where the GPU is idling. A machine that skimped on either component would show it in one half of that list.
Anyone who wants a large screen at a fixed desk. A 17.3in display at 144Hz, driven by a card that reaches or approaches that refresh in the lighter titles, is a coherent package for a machine that mostly stays in one place.
Who should buy something else
Anyone needing a decision based on price today. With no confirmed UK price for this machine or any of its four comparison rivals, there is no way to say whether it represents sensible spending. If value is the question you need answered, compare machines whose prices are confirmed.
Anyone who carries a laptop daily. A 17.3in chassis at 2.51kg plus an adapter sized for a 140W graphics card is a real load, and the footprint obstructs more than the mass does. If the machine goes in a bag every morning, its size will inconvenience you far more often than its frame rates will please you.
Anyone who wants more than 1080p. The panel is 1920x1080 and cannot be changed. If you want a sharper display this is the wrong machine, however well its graphics card performs - no amount of GPU capability compensates for a resolution you would rather not look at.
Anyone whose games are dominated by CPU-bound titles. Look hard at Dota 2 at 138fps and X-Plane 11 at 81fps. Neither is set by the graphics card, and buying a bigger GPU will not raise them. If your library is simulators, strategy games, MOBAs and older engines, a machine spending more of its budget on the processor would serve you better - and the identical four-game average against the 4060-equipped Helios 16 supports exactly that reasoning.
Anyone who wants the fastest thing in this generation. The 80fps average deficit against the ROG Strix Scar 17 settles that. This is a well-configured mid-tier machine, not a flagship, and the gap is wide enough that no favourable framing closes it.
Anyone for whom noise is a deciding factor, or who needs a ranked position. A 140W graphics card has a great deal of heat to move and we have no acoustic measurements for this chassis whatsoever - treat that as unresolved rather than assumed if you play in a shared room. And the incomplete scoring suite keeps this laptop out of the ranked table entirely, so if you want to know precisely where it falls in a list, it is not currently in that list.
The bottom line
Stripped to what the data supports: the Asus TUF Gaming A17 FA707XI-NS94 pairs a fully powered 140W RTX 4070 with a Zen 4 Ryzen 9 7940HS, 16GB of memory and a 17.3in 1920x1080 IPS panel at 144Hz, in a 2.51kg chassis carrying a 90Wh battery.
Across five games measured by Notebookcheck at 1920x1080 and High with upscaling off, results run from 210fps in F1 22 to 81fps in X-Plane 11, with a mean of 106fps across the three scoring-suite titles present. One game clears the panel's refresh rate, one comes within a handful of frames of it, and the other three sit comfortably above the point where frame rate stops being the problem. The spread says more about the games than the machine - Cyberpunk is slow because the graphics card is saturated, X-Plane because it is waiting.
Against its own generation the picture is clear. It comfortably outruns a thin machine with a smaller card. It cannot be separated from two well-configured 4060 laptops across the shared 1080p titles, which says more about the limits of 1080p testing and the importance of a generous power limit than about tier badges. It loses heavily to the generation's flagship, by a margin the test conditions understate.
The strongest case for this laptop is one most reviews in its class cannot make: the resolution it was measured at is the resolution its own panel runs, so there is no extrapolation in any of the conclusions above. What is missing is everything around the frame rates - thermals, noise, battery runtime, panel quality, two of the five scoring games, and a price. Without that last one, whether any of this is worth paying for stays an open question.