Review
MSI Stealth 17 Studio review
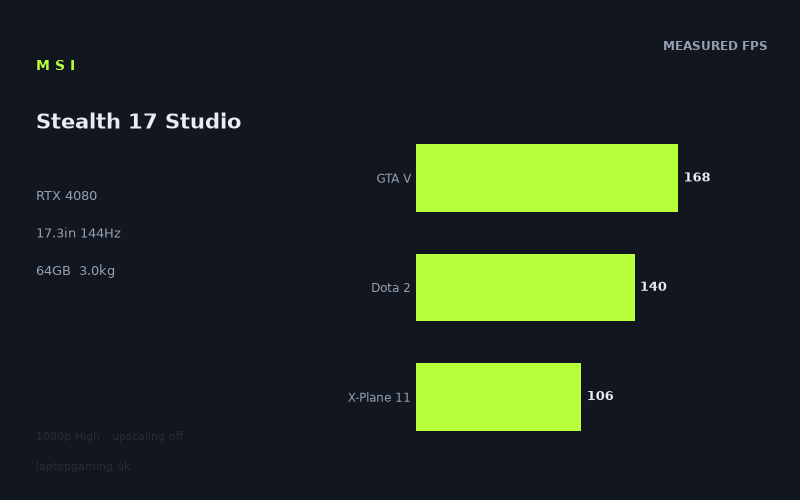
Frame rates
1920×1080, High preset, upscaling off.
Measured on this machine. Source: Notebookcheck, 2023-04-23.
Not scored: incomplete benchmark suite
Every scored laptop on this site is averaged over the same 5 games, and this one is short of Cyberpunk 2077, Baldur's Gate 3. A mean over 3 games is not comparable to a mean over 5, so we publish the figures we have and leave the score blank rather than rank it against machines tested on a different set. The numbers below are real - the suite is just incomplete.
How these numbers were produced
Frame rates here are not measured by us, and we label how each one was arrived at. A figure marked measured comes from a published run on that exact machine. A figure marked representative is derived from the GPU and its power limit (TGP) and cross-referenced against published reviews - a sound estimate of what that configuration delivers, but not a measurement of that specific laptop. Unless stated otherwise, numbers are 1920x1080, High preset, upscaling off. Where a laptop ships in several power configurations we use the wattage of the exact SKU listed, because a 140W RTX 5070 and a 115W one are not the same product.
In use
The short version
The MSI Stealth 17 Studio A13VH-014 is a large-format gaming laptop built around an RTX 4080, a Core i9-13900H, 64GB of memory and a 17.3in Mini LED display with a 3840x2160 resolution and a 144Hz refresh rate. On paper, that is an expensive specification class, but the UK price for this particular configuration is not confirmed, so it is not possible to make a responsible value judgement yet. It may be a compelling purchase at the right price, but a high specification does not automatically make it good value.
The available performance data is encouraging at the measured setting: 1920x1080, High preset and upscaling disabled. Notebookcheck recorded 301fps in Strange Brigade, 274fps in The Witcher 3, 203fps in F1 22, 168fps in GTA V, 158fps in Far Cry 5, 140fps in Dota 2, 137fps in Hogwarts Legacy, 134fps in Final Fantasy XV, 106fps in X-Plane 11 and 105fps in Cyberpunk 2077 1.6. Those are strong results, particularly in the older and lighter games, and they show that this machine has substantial 1080p gaming capability without leaning on upscaling.
There is an important qualification, though. The screen is a native 3840x2160 panel, while every published frame rate here was measured at 1920x1080. That does not invalidate the benchmark data; 1080p remains a useful way to compare laptop performance. It does mean that the figures should not be read as a promise of matching results at the screen’s native resolution. The panel gives this laptop a very high-resolution desktop and gaming target, but there are no supplied 3840x2160 benchmark results for this configuration. Anyone buying specifically to play demanding games at native resolution needs to treat that as an unknown rather than assuming that an RTX 4080 makes the issue disappear.
This is therefore most convincing for a buyer who wants a powerful 17.3in machine, values a Mini LED 144Hz display, and is happy to make sensible resolution and settings choices game by game. It is especially suitable for someone whose library includes games such as Strange Brigade, The Witcher 3, F1 22, GTA V and Far Cry 5, where the measured 1080p High figures are at or above the panel’s 144Hz refresh rate. It is less straightforward for someone who expects every demanding release to run at 144fps, or who sees the 3840x2160 label as a guarantee of native-resolution gaming without compromises.
The data also needs interpreting with care because this laptop cannot currently be given a comparable overall ranking against the scored machines on the site. The scoring suite is incomplete: figures are missing for Cyberpunk 2077 and Baldur’s Gate 3. Every scored laptop is averaged over the same five games, so a partial set cannot fairly be ranked against them. That is not a criticism of the available results; it is simply a limit on what can honestly be concluded from them. The benchmark figures are useful. A formal cross-site position is not available.
One further limitation matters for readers trying to understand why this RTX 4080 performs as it does. The supplied specification does not confirm this MSI’s GPU power limit. Laptop RTX 4080 implementations can differ materially according to their configured power limit, but there is no wattage figure here for the Stealth 17 Studio. It would be wrong to assign it a power figure, to compare it directly with a named wattage configuration, or to claim that its results prove a particular power setting. The measured figures tell us what this specific laptop delivered in the listed games and settings; they do not tell us the configured GPU limit.
Performance
What the published figures establish
Notebookcheck’s figures, dated 2023-04-23, were measured at 1920x1080 using the High preset with upscaling off. That combination is important. High settings are demanding enough to separate machines in modern games, while the lack of upscaling means the results are not being inflated by a reconstruction mode. These are straightforward native-rendered 1080p figures at the chosen preset. They are not native-resolution 3840x2160 results, they are not maximum-settings results, and they are not results with upscaling enabled.
The range is wide, from 301fps in Strange Brigade to 105fps in Cyberpunk 2077 1.6. That spread is not surprising and should not be mistaken for inconsistency in the laptop itself. Games place very different demands on the processor and graphics hardware, and the listed titles span older, lighter games, competitive games, driving games, open-world games, simulation and more graphically demanding releases. One headline number would hide the distinction between a machine that is exceptionally fast in lighter titles and merely strong in more demanding ones. The individual figures are much more useful than a single average for deciding whether this is the right laptop for a particular game library.
The three-game scoring-suite mean is 138fps across GTA V, Dota 2 and X-Plane 11. That is a useful summary of those three titles, but it should not be treated as a universal expectation. GTA V reached 168fps, Dota 2 reached 140fps and X-Plane 11 reached 106fps. Even inside that limited group, the variation is substantial. A buyer interested primarily in simulation should pay closer attention to the X-Plane 11 result than to the mean. A buyer interested in older open-world games should focus on GTA V. A buyer looking for high-refresh multiplayer play should note that Dota 2 sits very close to, but just below, the display’s 144Hz refresh rate at the measured settings.
At 1080p High, the Stealth 17 Studio is not struggling for performance. The question is instead how that performance relates to the display and to a buyer’s expectations. In several games, the measured output is beyond what a 144Hz panel can show as distinct refreshes. In others, it is close enough to 144fps that small changes in in-game settings may matter to someone trying to prioritise refresh-rate matching. In the demanding titles, the published frame rates remain above 100fps but are clearly below 144fps. That is a good place to be for smooth-looking gaming in broad terms, but it is not the same thing as a locked 144fps experience.
Games that meet the 144Hz target at the measured setting
Strange Brigade is the standout result at 301fps. That is far beyond the 144Hz refresh rate of the built-in screen at the tested 1080p High setting. The significance is not that the laptop can display every one of those frames separately on its own panel; it cannot exceed the panel’s stated refresh rate. The significance is that the available performance headroom is very large in this title. A player choosing this machine for games of similar weight is unlikely to be constrained by the raw 1080p High result.
The Witcher 3 reached 274fps, another result well over 144fps. Again, the most useful conclusion is not that the number itself will be visible as a matching refresh rate on the internal display. Rather, it shows that the RTX 4080 and Core i9-13900H combination has ample measured 1080p High performance in this game. For a buyer who spends a great deal of time in The Witcher 3, this is one of the clearest examples of the Stealth 17 Studio using its hardware effectively at the published setting.
F1 22 recorded 203fps. That is comfortably above the panel’s refresh rate, giving this laptop a strong measured position for the game at 1080p High without upscaling. The result matters because it is not merely a narrow pass over 144fps. There is a meaningful gap between 203fps and the display ceiling, which gives the buyer more confidence in the measured setting than a result sitting just one or two frames above the target would.
GTA V reached 168fps. That puts it above the screen’s 144Hz refresh rate, although not by the margin seen in Strange Brigade or The Witcher 3. The result is still a clear success for 1080p High gaming on the internal panel. It also matters to the incomplete scoring suite, because GTA V is one of the three scoring-suite games available for this machine. The 168fps result is a major reason why the three-game mean reaches 138fps despite X-Plane 11 being much lower.
Far Cry 5 reached 158fps, also above 144fps. This is another title where the published result aligns neatly with the specification of the screen, at least at the tested 1080p setting. It is reasonable to say that the machine has the measured performance for high-refresh play here. It is not reasonable to turn that into a wider claim about all current games, because the results in Hogwarts Legacy, Final Fantasy XV, X-Plane 11 and Cyberpunk 2077 1.6 show that the balance changes quickly in more demanding software.
Games close to the refresh rate
Dota 2 recorded 140fps. That is only just below the panel’s 144Hz specification, so the distinction matters more to a player who is specifically chasing a full refresh-rate match than to someone looking for generally high frame rates. At the stated 1920x1080 High setting with upscaling disabled, the laptop does not quite reach 144fps in the published figure. It is nevertheless very close, and the result should be read as high-refresh territory rather than as a disappointment. The exact number is still important: “close” is not the same as “at or above”.
Hogwarts Legacy reached 137fps and Final Fantasy XV reached 134fps. Both are below 144fps, but neither is remotely close to the lower end of the benchmark list. They sit in the zone where the Stealth 17 Studio is delivering a high frame rate at the measured setting, while falling short of the panel’s maximum refresh rate. This is where buyers should separate two expectations. If the aim is a strong, high-frame-rate 1080p experience, these numbers are positive. If the aim is to saturate a 144Hz screen in every game using the same High setting, they show that the machine cannot be assumed to do that.
Those results are also a useful warning against judging an RTX 4080 laptop from its strongest games alone. It would be easy to look at 301fps in Strange Brigade or 274fps in The Witcher 3 and conclude that 144fps is routine. Hogwarts Legacy at 137fps and Final Fantasy XV at 134fps provide the necessary counterweight. This laptop is fast, but its performance is game-dependent in exactly the way a useful benchmark suite should reveal.
The demanding end of the results
X-Plane 11 reached 106fps. That is the lowest of the three available scoring-suite results and is notably below the display’s 144Hz refresh rate. It is still a substantial frame rate on its own terms at 1080p High with no upscaling, but it demonstrates why the three-game mean should be handled cautiously. Someone buying this laptop for X-Plane 11 should use 106fps as the relevant published data point rather than expecting the 138fps mean to describe their experience.
Cyberpunk 2077 1.6 reached 105fps, essentially alongside X-Plane 11 in the supplied results. This is one of the clearest signs of the difference between lighter games and demanding ones. The Stealth 17 Studio is still over 100fps in the measured configuration, which is a strong result, but it is not approaching the 144Hz refresh rate. The fact that upscaling was off makes the number a clean reference point for this setting, but it does not allow any conclusion about how the laptop would behave with a different rendering mode, different preset or at the panel’s native resolution.
The lower result in Cyberpunk 2077 1.6 also has a scoring consequence. Although a Cyberpunk figure is available in the general benchmark list, the scoring suite is incomplete because the required figures for Cyberpunk 2077 and Baldur’s Gate 3 are not both present in the relevant scoring format. The machine should therefore not be placed in a scored ranking against laptops with a complete five-game result. The missing information should not be replaced with assumptions based on the available 105fps figure.
Across the list, 105fps is the lowest measured result and 301fps the highest. That is a very broad performance envelope. It tells a potential buyer that this is not a machine whose value rests on identical results across every genre. It is a machine with extremely high 1080p output in some games, high output in many others, and a more limited but still substantial result in the demanding examples supplied. That is the honest performance character of the data.
What the unknown GPU power limit means
The RTX 4080 name is useful, but it is not a complete performance description on its own. Laptop graphics processors are configured by manufacturers, and the power limit can affect the eventual benchmark result. For the Schenker XMG Apex 15, the supplied rival information explicitly identifies an RTX 4050 at 140W. No equivalent figure is provided for the MSI Stealth 17 Studio. That omission prevents a direct wattage comparison.
It would be tempting to infer the MSI configuration from its frame rates, its size or its 3.0kg weight. That would not be sound. The benchmark results show the performance delivered by this exact machine under Notebookcheck’s stated test conditions. They do not reveal the configured GPU power limit, and the weight does not establish it either. A prospective buyer who regards GPU wattage as a deciding specification should seek confirmation from a reliable listing or manufacturer documentation before purchasing. It should not be guessed from the RTX 4080 label.
The practical point is that the measured results matter more than an assumed wattage for the listed games. We know this Stealth 17 Studio achieved 203fps in F1 22, 168fps in GTA V and 105fps in Cyberpunk 2077 1.6 at the stated setting. We do not know its stated GPU power limit. Both facts can coexist without weakening the useful part of the review. The mistake would be presenting a performance explanation that the supplied information cannot support.
The screen
The Stealth 17 Studio’s 17.3in display is one of its defining features. It combines a 3840x2160 resolution, a 144Hz refresh rate and Mini LED panel technology. Those are desirable specifications for a buyer who wants a large, high-resolution laptop screen rather than a smaller, more purely portable gaming machine. The 17.3in size gives the panel physical presence, the resolution provides a very high desktop resolution, and 144Hz is a meaningful refresh-rate target for gaming.
However, the benchmark data and the panel specification are pointing at different operating points. The screen is specified at 3840x2160, while Notebookcheck’s results are all at 1920x1080. The laptop has shown that it can run several games at or beyond 144fps at 1080p High, but no supplied evidence establishes native-resolution performance. It would be inaccurate to suggest that 301fps in Strange Brigade becomes 301fps at 3840x2160, or that 105fps in Cyberpunk 2077 1.6 does. There is simply no measured native-resolution data in the fact sheet.
That makes the display a strength with an important purchasing caveat. For desktop use and for games where a buyer is comfortable choosing a resolution below the panel’s native setting, the specification is attractive. For a buyer whose priority is native-resolution gaming at 144Hz, the evidence is incomplete. The combination of a 3840x2160 panel and a 144Hz refresh rate is aspirational, but the supplied figures only show what the machine does at 1920x1080.
The 144Hz refresh rate is most directly supported by the 1080p High results in Strange Brigade, The Witcher 3, F1 22, GTA V and Far Cry 5. Each is above 144fps: 301fps, 274fps, 203fps, 168fps and 158fps respectively. Dota 2 is close at 140fps. Hogwarts Legacy, Final Fantasy XV, X-Plane 11 and Cyberpunk 2077 1.6 are below the refresh rate at 137fps, 134fps, 106fps and 105fps. This creates a clear split. The panel’s refresh ceiling is realistically relevant in some games at the measured settings, but not all.
Mini LED is also a notable specification, but the panel label alone does not establish brightness, colour coverage, contrast behaviour, response behaviour or HDR performance. None of those measurements are supplied here. It would be wrong to describe the display as excellent for colour-critical work, to claim a particular HDR result, or to make claims about black levels without evidence. The useful conclusion is limited but still meaningful: this is a 17.3in Mini LED panel with 3840x2160 resolution and 144Hz refresh, and it is a more ambitious screen specification than the benchmark resolution alone might suggest.
The screen therefore suits a buyer who values workspace and a large panel alongside gaming. It is less suited to a buyer who wants benchmark evidence that every game can be driven at native resolution and maximum refresh. The distinction is not a flaw in the machine; it is a matter of matching a high-resolution display to the evidence actually available.
Build, size and portability
This is not a lightweight gaming laptop. At 3.0kg, the MSI Stealth 17 Studio belongs in the large-machine category. The 17.3in screen already indicates that it is intended to provide a more expansive experience than a compact gaming notebook, and the weight reinforces that. It can be moved, but it should not be treated as the obvious choice for someone who expects to carry a gaming laptop constantly through the day.
The practical use case is more likely to be a machine that spends much of its time in one place, perhaps moving between rooms, homes, offices or occasional travel locations rather than living permanently in a bag. A 3.0kg laptop can still make sense for a buyer who wants one computer for gaming and other demanding work, particularly when that buyer values the 17.3in panel and 64GB of memory. But portability is not the central attraction here. Screen size, specification and measured performance are.
No dimensions are supplied, so it would be wrong to claim that it will fit a particular bag, desk depth or travel setup. The weight provides a useful starting point, but it does not tell us the chassis footprint or thickness. Likewise, no information is supplied about materials, keyboard layout, ports, webcam, speakers, upgrade access, cooling behaviour or construction quality. Those are all important purchasing considerations, but they cannot be filled in with generic assumptions about the Stealth name or about gaming laptops of this size.
The 99Wh battery is large in stated capacity, but capacity is not a measured battery-life result. There is no supplied runtime figure for gaming, web use, video playback or idle use. It would be misleading to promise all-day use, to estimate gaming duration, or to compare endurance with rivals. The battery specification does at least indicate that this is not a machine equipped with a small battery, but the actual duration depends on workloads and conditions not documented in the fact sheet.
For someone who wants a desktop replacement with the option of transport, 3.0kg and 99Wh are reasonable specifications to consider. For someone whose first priority is low carry weight and known unplugged endurance, the available evidence does not make this the safest purchase. The battery capacity is known; the battery life is not. The weight is known; the dimensions are not. That uncertainty should be part of the buying decision rather than hidden behind broad claims about portability.
How it compares
The comparison data covers four rivals from the same GPU generation, ranging from RTX 4050 systems to an RTX 4090 machine. None has a confirmed UK price in the supplied information, and the MSI’s own UK price is also not confirmed. This means the comparison has to stay focused on the shared-game frame-rate differences rather than pretending to establish value. The relevant question is which machine produced more frames in the games both systems hold, not which is the better deal at an unknown price.
Against the Schenker XMG Apex 15
The MSI averages 58fps ahead of the Schenker XMG Apex 15 across six shared games. The Apex 15 is listed with an RTX 4050 at 140W. This is the largest favourable comparison supplied for the Stealth 17 Studio, and it is the clearest evidence that the MSI’s RTX 4080 configuration can deliver a meaningful advantage over a lower-tier GPU system when the shared benchmark set is broad enough to expose it.
The six-game basis matters. It is a wider comparison than the three-game rival comparisons elsewhere in the data, so it gives a more substantial picture of the difference between these two machines than a single title could. A 58fps average lead is not a near-zero result that can be dismissed as benchmark noise or a CPU-bound quirk in lighter games. It indicates a real performance separation across the games held in common.
That does not mean the MSI should automatically be bought over the Apex 15. Price remains unconfirmed for both, and no screen, weight, battery or other configuration comparison is supplied for the Schenker. It does mean that a buyer whose priority is the available shared-game performance data has a clear reason to prefer the Stealth 17 Studio. The RTX 4080 machine is not merely matching the RTX 4050 rival in this comparison; it is materially ahead.
Against the Medion Erazer Crawler E40
The Medion Erazer Crawler E40, also an RTX 4050 machine, is a much more surprising comparison. The MSI averages 1fps behind it across three shared games. That is effectively a near-zero result, and the supplied comparison guidance explains why such results can occur: at 1080p, lighter titles in the shared set can be CPU-bound and compress genuine GPU gaps.
This should not be read as evidence that an RTX 4050 is broadly equivalent to this RTX 4080 laptop. The six-game comparison with the XMG Apex 15 points in the opposite direction, with the MSI ahead by 58fps. The Medion comparison only covers three shared games, and the near-zero gap is precisely the kind of result that can arise when the games being compared are limited by factors other than the graphics processor at 1080p. The correct conclusion is narrow: in this particular three-game shared sample, the MSI is 1fps behind.
For a buyer, that result is a reminder not to buy solely from GPU naming or solely from one average. If the games that matter to you resemble the limited shared set, the raw advantage of the MSI may not reveal itself at the tested resolution. If your game library is broader or more graphically demanding, the wider Apex comparison is more suggestive of what a higher-tier GPU can offer. Without the individual Medion shared-game figures, no more detailed claim can be made.
Against the Schenker XMG Core 15
The Schenker XMG Core 15 (M24) with an RTX 4060 also averages 1fps ahead of the MSI across three shared games. As with the Medion result, this is a near-zero difference. It should be explained, not exaggerated. The provided context is that lighter 1080p games in the shared set can become CPU-bound and compress genuine GPU differences. That is the sensible interpretation here.
The Core 15 comparison does not overturn the broader picture of the MSI as a high-performance machine. It tells us that, in the three games held in common, the available average does not show a meaningful advantage for the RTX 4080 system. It does not tell us that every game will be equal, that the RTX 4060 is generally faster, or that the MSI’s RTX 4080 has failed to perform. Those claims would go beyond the evidence.
For shoppers considering the Core 15, this makes price and the rest of the specification especially important, but neither machine has a confirmed UK price in the supplied material. The MSI brings a 17.3in 3840x2160 144Hz Mini LED display, 64GB of memory, a 3.0kg weight and a 99Wh battery to its own specification. No corresponding details are supplied for the Core 15, so there is no honest basis for declaring one design better suited to travel, display quality or battery use. The only firm comparison is the 1fps average gap across three shared games.
Against the Asus ROG Strix Scar 17
The Asus ROG Strix Scar 17 is the strongest rival listed, with an RTX 4090. The MSI averages 61fps behind it across three shared games. Unlike the Medion and Core 15 comparisons, this is not a near-zero result. It is a substantial performance separation in the available shared sample, and it establishes that the Scar 17 is the better choice for a buyer whose priority is maximum shared-game frame rate.
That does not make the MSI’s own figures weak. A laptop can record 301fps in Strange Brigade, 203fps in F1 22 and 105fps in Cyberpunk 2077 1.6 and still trail a faster RTX 4090 rival. The useful point is relative positioning: the MSI is a powerful RTX 4080 machine, not the performance leader in this particular generation spread. Buyers with an uncompromising requirement for the highest available frame rates should recognise the Scar 17’s measured advantage.
Once again, price prevents a value conclusion. The Scar 17 has no confirmed UK price in the supplied information, and neither does the MSI. It would be irresponsible to say that the RTX 4090 advantage is worth paying for without knowing the cost difference. What can be said is simpler: the Scar 17 is ahead by 61fps on average across the three games both machines hold, while the MSI remains the machine with the 17.3in 3840x2160 144Hz Mini LED specification described here.
Who it’s for
The MSI Stealth 17 Studio is for the buyer who wants a large, high-specification gaming laptop and understands the difference between a screen’s native resolution and a benchmark resolution. Its most obvious audience is someone who values the 17.3in 3840x2160 Mini LED display, wants 64GB of memory, and is prepared to use the machine as a substantial portable computer rather than a light everyday carry device.
It is also for players whose games align with the stronger half of the measured results. Strange Brigade at 301fps, The Witcher 3 at 274fps, F1 22 at 203fps, GTA V at 168fps and Far Cry 5 at 158fps show that the laptop can meet or exceed the panel’s 144Hz refresh rate at 1080p High in several titles. Dota 2 at 140fps is close enough that it remains a sensible high-refresh option, even though it does not quite meet the stated refresh rate in the published figure.
It is a reasonable choice for someone who plays demanding games but does not insist on a universal 144fps target. Hogwarts Legacy at 137fps, Final Fantasy XV at 134fps, X-Plane 11 at 106fps and Cyberpunk 2077 1.6 at 105fps are all meaningful results at the tested setting. They show a machine that remains fast even when it does not fill the 144Hz panel. A buyer who can accept that different games will produce different outcomes will get a more realistic picture of what the hardware offers.
It is not the best fit for someone who wants confirmed native 3840x2160 gaming performance. The display supports that resolution, but the supplied benchmark data does not. Buyers who refuse to run demanding games below native resolution should wait for appropriate measured results rather than using the 1080p numbers as a substitute.
It is not the best fit for someone who needs a lightweight laptop for constant carrying. At 3.0kg, this is a large machine with a large screen. It may be transportable, but it is not the natural option for a buyer whose priority is minimal bag weight. Nor is it the right purchase for someone who needs a verified battery-life figure, because only the 99Wh capacity is supplied and no runtime data is available.
It is also not automatically the right answer for a buyer who wants the fastest frame rates available from this GPU generation. The Asus ROG Strix Scar 17 with RTX 4090 averages 61fps ahead across three shared games. If maximum performance is the sole priority, that is meaningful evidence in the Scar’s favour. Whether that advantage justifies any price difference cannot be assessed because neither machine has a confirmed UK price in the available information.
Conversely, the MSI should not be dismissed because it is 1fps behind the Medion Erazer Crawler E40 and 1fps behind the Schenker XMG Core 15 in their respective three-game shared comparisons. Those are effectively tied results in limited 1080p samples, where CPU-bound lighter games can compress genuine GPU gaps. The more revealing wider comparison is against the RTX 4050 Schenker XMG Apex 15, where the MSI leads by 58fps across six shared games.
The final buying advice is therefore conditional. Buy the Stealth 17 Studio if the eventual UK price is sensible for a large RTX 4080 laptop with a 17.3in 3840x2160 144Hz Mini LED display, if 3.0kg suits the way you travel, and if the published 1080p High results match the games you actually play. Look elsewhere if you need verified 3840x2160 performance, verified battery life, a lighter machine, or the generation’s strongest shared-game frame rates. The available data supports confidence in this MSI as a powerful 1080p High gaming laptop. It does not support assumptions beyond that evidence.