Review
Asus Zephyrus Duo 16 review
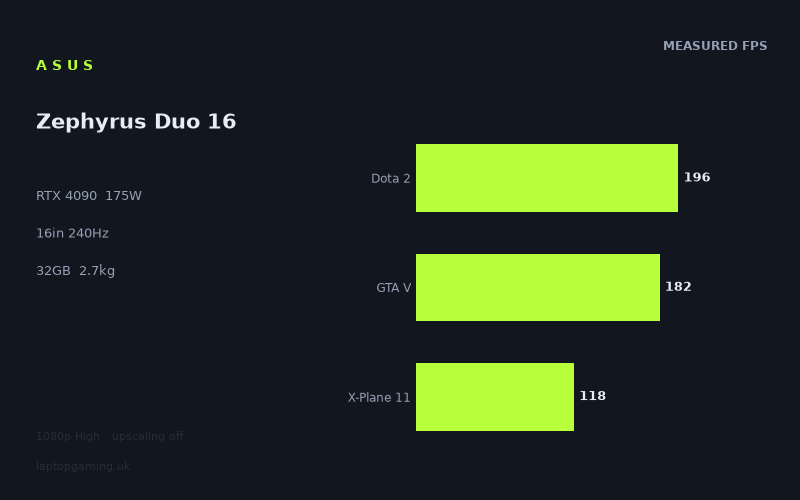
Frame rates
1920×1080, High preset, upscaling off.
Measured on this machine. Source: Notebookcheck, 2023-03-15.
Not scored: incomplete benchmark suite
Every scored laptop on this site is averaged over the same 5 games, and this one is short of Cyberpunk 2077, Baldur's Gate 3. A mean over 3 games is not comparable to a mean over 5, so we publish the figures we have and leave the score blank rather than rank it against machines tested on a different set. The numbers below are real - the suite is just incomplete.
How these numbers were produced
Frame rates here are not measured by us, and we label how each one was arrived at. A figure marked measured comes from a published run on that exact machine. A figure marked representative is derived from the GPU and its power limit (TGP) and cross-referenced against published reviews - a sound estimate of what that configuration delivers, but not a measurement of that specific laptop. Unless stated otherwise, numbers are 1920x1080, High preset, upscaling off. Where a laptop ships in several power configurations we use the wattage of the exact SKU listed, because a 140W RTX 5070 and a 115W one are not the same product.
In use
The short version
The Zephyrus Duo 16 is a top-tier machine built around an RTX 4090 running at a 175W power limit, and the measured frame rates behave exactly as that specification promises: 370fps in Strange Brigade, 361fps in The Witcher 3, 196fps in Dota 2, 182fps in GTA V, and nothing in the eleven-title set below 118fps. This is a laptop with no weak results.
The rest of the specification is equally uncompromising. A Ryzen 9 7945HX, 32GB of memory, a 2TB SSD, a 16in 2560x1600 Mini LED panel at 240Hz, a 90Wh battery, and 2.666kg of chassis to hold it all. That weight is high for a 16in machine, and it is high for a reason that our record hints at without spelling out — the "Duo" in the name refers to Asus's secondary display, the defining feature of this line. Our record holds a specification for one panel only, so we have no resolution, refresh rate or panel technology for the second screen and will not describe it in detail. That is a real gap in what we know about a machine whose entire identity is built on it.
This page carries no score. Our scoring suite is five games and we hold three of them here — Dota 2, GTA V and X-Plane 11. There is no Baldur's Gate 3 figure, and while there is a Cyberpunk 2077 number, it is for version 1.6, a build too different from the current one to be comparable. A three-game average cannot be ranked against five-game averages without corrupting the leaderboard, so we withhold the score rather than publish a misleading one.
Buy it if you want a genuine top-tier GPU with a confirmed power limit, a Mini LED display, and a dual-screen layout you have actually thought about how to use. Look elsewhere if the second screen is a novelty to you rather than a workflow, if you want the fastest possible RTX 4090 laptop regardless of form factor, or if you play mostly lighter titles where — as the comparisons below show in unusually stark form — far cheaper hardware produces the same numbers.
Performance
What 175W means, and why it is the number to look for
Our record holds a 175W power limit for this machine's RTX 4090, and that single figure is worth more than most of the rest of the specification sheet combined.
Nvidia allows laptop manufacturers to configure the same mobile GPU across a wide band of power limits, and the difference between the bottom and the top of that band is frequently larger than the difference between two adjacent GPU tiers. A generously configured lower-tier card can beat a restricted higher-tier one. This is not an edge case; it is how the mobile GPU market actually works, and it is why a listing that says only "RTX 4090" is telling you which silicon is inside without telling you how hard it is permitted to work.
175W is at the upper end of what the RTX 4090 was configured at in this generation, and in a 16in chassis it represents a substantial engineering commitment. Moving that much heat out of a 16in laptop requires fans, heat pipes and exhaust area, and it is a large part of why this machine weighs 2.666kg — a figure that would look excessive on a 16in laptop with a mid-range GPU and looks entirely reasonable on one running a 4090 this hard.
The reason to celebrate a stated TGP rather than merely note it is that most listings do not give you one. Several machines in the comparison set below have no power limit on our record at all, which means we cannot explain their results. Here we can. When this machine beats a 100W RTX 4050 by 109fps across six games, we know exactly what combination of hardware produced that gap.
The top of the chart: a processor ceiling, not a GPU one
Notebookcheck's measured figures at 1920x1080 on High with upscaling disabled begin with Strange Brigade at 370fps, The Witcher 3 at 361fps and F1 2021 at 312fps.
Numbers of that size are not primarily a statement about the graphics card. At 1080p on High, an older or deliberately lightweight engine does not give a top-tier GPU enough work to keep it occupied; the card finishes each frame long before the processor has prepared the next, and the frame rate settles at whatever the CPU, the engine's own limits and driver overhead permit. Those three results are a measure of the Ryzen 9 7945HX and the platform around it, with the RTX 4090 largely idling.
That has a direct practical consequence, and it is the same one that applies to every machine at this tier: a very large fraction of this GPU's capability is invisible in light games at low resolution. If your library is dominated by titles in this bracket, the money spent on a 4090 buys frames neither your panel nor your eyes can resolve. The case for the hardware has to be made in the heavier titles, and it is — but it has to be made there.
F1 22 at 265fps and Shadow of the Tomb Raider at 208fps continue the descent as the workload gets genuinely heavier, and by 208fps the graphics card is beginning to matter.
The same game twice: what The Witcher 3 tells you about benchmark data
The single most instructive pair of numbers on this page is The Witcher 3 at 361fps and The Witcher 3 v4 at 158fps. Same game, same machine, same test methodology, same resolution and preset. The later version runs at well under half the frame rate of the earlier one.
That is not a measurement error and it is not inconsistency in the machine. The Witcher 3 received a substantial technical overhaul that added modern rendering features and dramatically increased what the engine asks of the hardware. The result is that "The Witcher 3" is now effectively two different benchmarks that happen to share a title, and mixing them would produce nonsense.
This matters far beyond one game, and it is exactly why our scoring suite refuses the Cyberpunk figure on this page. There is a Cyberpunk 2077 result in the data — 136fps — but it is tagged version 1.6. Cyberpunk changed significantly after that build, in both what it renders and how it performs, so a 1.6 result and a current-build result are different tests wearing the same name. Slotting the 1.6 number into the suite average would inflate this machine's standing against every laptop measured on the current build. It is precisely the kind of quiet corruption that turns a leaderboard into decoration, and it is why the score is withheld instead.
The honest version of that argument is worth stating plainly: we could publish a score for this machine tomorrow by being slightly less careful. We would rather have three fewer scored laptops and a ranking that means something.
The middle and the floor
Dota 2 at 196fps and GTA V at 182fps are two of the three scoring-suite games we hold, and both are strong. Dota 2 at 196fps in particular is a healthy result for a competitive title, though — as with the very top of the chart — it is a processor result rather than a GPU one, and it falls short of the panel's 240Hz refresh rate.
Final Fantasy XV at 170fps sits between them and the heavier material. The Witcher 3 v4 at 158fps and Cyberpunk 2077 1.6 at 136fps are the two genuinely GPU-limited results in the set, and they are where the 4090 at 175W is finally the component doing the work rather than waiting.
X-Plane 11 at 118fps is the lowest figure in the entire eleven-title set, and it is the third scoring-suite game. Its position is not a criticism of the machine — flight simulation loads the processor with work no graphics card can offload, which is exactly why the title is in the suite. A laptop that manages 370fps in Strange Brigade and 118fps in X-Plane 11 is telling you that its performance is not uniform across workloads, and any single headline number would hide that.
The mean across the three suite games we hold is 165fps. That is a high figure, but it is an average over an easier subset — Cyberpunk 2077 on its current build and Baldur's Gate 3 are both heavier than Dota 2 and GTA V — so it should be read as a description of this machine rather than as a position in a table.
What the distribution shows
Eleven measured titles running from 370fps down to 118fps is a spread of roughly three to one, which is narrower than most machines in our data. That narrowness is itself informative, and it comes from two directions.
At the top, the spread is compressed because the processor imposes a ceiling that the GPU never reaches. At the bottom, it is compressed because there is nothing in this test set heavy enough to trouble an RTX 4090 at 175W. The measurement set dates from early 2023, before the Unreal Engine 5 showcase titles that push modern hardware hardest. There is no Alan Wake 2 here, no Hellblade 2, no Black Myth. Those would have pulled the bottom of the chart down considerably and given a clearer picture of the GPU's real ceiling.
That is a limitation worth naming. The lowest measured result on this machine is 118fps, and it is a processor-bound flight simulator rather than a graphics showcase. The data available tells you this machine handles everything it was tested on with room to spare. It does not tell you where its limits are, because nothing in the set found them.
The screen
A 16in 2560x1600 Mini LED panel at 240Hz. Each element of that specification does something distinct, and the interaction with the benchmark data is where the analysis lives.
Mini LED, and what it is for
Mini LED is a backlight technology rather than a panel technology in the way OLED is. The liquid crystal layer works as it does in an IPS display, but the backlight behind it is divided into a large number of independently dimmable zones. Where a conventional backlight illuminates the whole panel uniformly and lets the liquid crystal try to block light in dark areas — which it never does perfectly, hence the grey-black of most laptop screens — a Mini LED backlight simply turns off the zones behind dark content.
The result is contrast far beyond what a standard IPS panel achieves, and peak brightness in bright highlights that OLED laptop panels generally cannot match. For HDR content and for games with strong bright-against-dark composition, that is a genuine and visible advantage. The trade-off is blooming: because zones are larger than pixels, a small bright object on a black background can produce a visible halo. How pronounced that is depends entirely on the number of zones and the quality of the dimming algorithm, and our record holds no measurement of either, nor any brightness or contrast figures for this specific implementation. We are describing the technology, not this panel. If HDR performance is central to your purchase, that is a specification to verify against the listing.
Against the alternatives in this generation, Mini LED is the choice that trades OLED's perfect blacks and instant pixel response for higher sustained brightness and no burn-in risk. On a machine likely to spend long hours displaying a static desktop or a game HUD, the absence of burn-in risk is not a trivial consideration.
The resolution gap in the data
Every measured figure on this page was recorded at 1920x1080. The panel is 2560x1600, which is close to double the pixels per frame. We hold no native-resolution measurements for this machine, and that gap needs stating clearly rather than glossed over.
The effect is not uniform across the test set, and understanding why is the useful part. In the processor-bound titles at the top — Strange Brigade, The Witcher 3, F1 2021, Dota 2 — the drop will be modest, because the graphics card was never the constraint and adding pixels gives it work it has capacity for. In the genuinely GPU-limited results — The Witcher 3 v4 at 158fps, Cyberpunk 1.6 at 136fps — the drop will be considerably larger, because the extra pixels land directly on the component already doing the work.
Here, though, the situation is far more comfortable than on a mid-range machine with the same panel. An RTX 4090 at 175W has an enormous amount of headroom in every title measured, and the lowest figure in the set is 118fps. Even a substantial proportional drop from figures like these leaves results that are perfectly playable. This is what a high-resolution panel on a top-tier GPU is supposed to look like: the resolution converts spare capacity into image quality rather than eating into playability. The same panel on a mid-range machine would be a liability. Here it is the correct pairing.
240Hz, and who it serves
Taking the 1080p figures at face value — which, per the point above, flatters the panel's native resolution — four of the eleven titles clear 240fps: Strange Brigade, The Witcher 3, F1 2021 and F1 22, with Shadow of the Tomb Raider at 208fps the next nearest. The scoring-suite games sit between 118fps and 196fps.
So the panel's refresh ceiling is reachable, but in lighter titles and at a resolution below the screen's own. At native 1600p it will be reachable in fewer of them. That does not make the refresh rate pointless — a high-refresh panel with variable refresh support improves the experience at any frame rate, and the difference between a lower-refresh screen and this one is visible in fast motion well below the ceiling — but it does mean the 240Hz figure should be read as headroom rather than as a target the machine hits routinely.
The second screen we can't tell you about
This is the Duo, and the second display is the reason anyone chooses it over a conventional 16in machine. Our record contains no specification for it: no resolution, no refresh rate, no panel technology, no dimensions. That is a significant hole, and it is worth flagging as something to verify rather than something to assume.
What can be said without inventing anything is structural. A secondary display in the palm-rest area displaces the keyboard towards the front edge of the chassis and eliminates the wrist rest, which changes the ergonomics of typing substantially — usually for the worse without an external keyboard or a wrist support. It adds weight, which is visible in the 2.666kg figure. It adds complexity to the hinge and the cooling layout. And it consumes power, which will affect battery life on a machine we have no battery measurements for.
Whether those costs are worth paying depends entirely on whether you have a real use for the second panel — a streaming layout, a timeline or mixer in creative work, reference material, chat and monitoring during play. For people who do, it is genuinely transformative and there is nothing else quite like it. For people who do not, it is weight, cost and a compromised keyboard position in exchange for a novelty. That is a judgement only you can make, and our record is not in a position to help you make it.
Build, size and portability
2.666kg on a 16in footprint, with a 90Wh battery and a 2TB SSD.
That weight is high for the screen size. To use our own data as a yardstick, the Asus ROG Strix Scar 17 in the comparison set below weighs 2.935kg on a 17.3in chassis — a full screen size larger for under three hundred grammes more. The Duo is carrying the mass of a second display, a more complex hinge assembly, and the cooling apparatus needed to run a 4090 at 175W, and all of that lands in a smaller footprint.
The practical reading is that this is a transportable machine rather than a portable one. It will move between rooms and between locations without difficulty. It is not a laptop to carry daily alongside everything else in a bag, and the charger for a 175W GPU will not be small — our record does not state its weight, so we will not guess, but the physics of delivering that much power leaves little room for a compact power supply.
The compensating benefit is the one this whole page rests on. A chassis with the volume to cool a 4090 at 175W is a chassis that produces the frame rates above. You cannot have the numbers without the mass; they are the same engineering decision viewed from two directions. Given that, 2.666kg is not a criticism so much as the price of the specification.
The 2TB SSD is a genuine practical strength and one of the more useful specifications on the sheet. Modern games routinely occupy well over 100GB, and a 2TB drive comfortably holds a substantial library without constant management. Machines at this tier frequently ship with half that, and the difference in daily use is larger than the cost difference implies.
The 90Wh battery is close to the maximum airlines generally permit in cabin baggage. We hold no battery-life measurement, so we will not tell you how long it lasts, and the second screen makes any general estimate less reliable than usual. What is true of every machine in this class is that gaming on battery is not a realistic proposition — a 175W GPU draws more power under load than a battery of this size can sustain, and the machine will reduce performance sharply when unplugged.
Our record holds no dimensions beyond the screen size, no thermal or acoustic measurements, no keyboard assessment and no display measurements. Noise is the most conspicuous gap: a 16in chassis dissipating 175W from the GPU alone, plus a sixteen-core processor, is not doing so quietly, and how loud it gets under sustained load is a legitimate purchasing consideration on which we have nothing to offer.
How it compares
The rival set is drawn from the same GPU generation and compared only on games both machines hold. It is unusually well-suited to making a single point, because it contains one enormous margin and two near-ties, and the contrast between them is the entire lesson.
Against the Lenovo Yoga Pro 9 16IMH9 — RTX 4050 at 100W — ahead by 109fps across six games
Six shared games is the largest sample in this comparison set, and an average lead of 109fps is decisive by any standard. This is what a two-tier GPU gap looks like when the test set is broad enough to contain it.
Note the detail that makes the result stronger rather than weaker: the Yoga's RTX 4050 is configured at 100W, which is a generous power limit for that GPU rather than a throttled one. This is not a comparison against a thin-chassis 4050 running at half its potential. It is a comparison against a 4050 being fed properly, and the gap is still enormous.
Hold on to that figure, because it is the control for everything that follows. When the same methodology, on overlapping titles, produces a 109fps separation, any claim that the benchmark cannot distinguish machines fails immediately.
Against the Lenovo Legion 5 16IRX G9 — RTX 4060 at 115W — ahead by one frame across three games
And here is the result that looks absurd until you understand it. An RTX 4090 at 175W, against an RTX 4060 at 115W, across three shared games: ahead by an average of a single frame.
That is not a measurement failure and it is not a defect in either machine. It is the direct consequence of testing at 1920x1080 with a three-game sample. At that resolution, the lighter titles in any shared set are limited by the processor rather than the graphics card. The GPU renders each frame faster than the CPU can prepare the next, and the frame rate settles at a ceiling the graphics card has no influence over. Put a 4090 and a 4060 into the same CPU-bound test and they will produce the same number, because in that test neither is the constraint.
With only three shared titles, the odds of the sample being dominated by such games are high, and evidently it was. Widen the comparison to six games against the Yoga Pro 9 and the gap becomes 109fps, because a broader set is far more likely to include genuinely GPU-limited work.
The buying lesson is specific and useful. If your library consists mainly of the kind of games that produced that tie, an RTX 4060 at 115W will deliver the same experience as an RTX 4090 at 175W. Not a similar experience — the same one, within a frame. That is a serious argument against spending at this tier for a large number of buyers, and it is the sort of finding that a marketing-led review would find reasons not to print.
The counter-argument is equally specific: the moment you play something that actually loads the GPU, the two machines separate by a wide margin, and the 4090 machine has headroom to spend on native 1600p rendering, on higher settings, and on games released after this data was gathered. The tie describes a set of conditions, not a general truth.
Against the Medion Erazer Beast X40 — RTX 4090 — level across three games
Same GPU tier, and across three shared games the two machines are indistinguishable; the average difference rounds to nothing in either direction. Our record does not hold a power limit for the Medion, which limits how much can be concluded.
Two RTX 4090 machines from different manufacturers, in different chassis, producing the same numbers, is the expected result rather than a surprise. The GPU sets the level and everything else operates at the margins — and in a three-game sample at 1080p, the margins are compressed further by the CPU-bound effect described above.
The practical implication is that choosing between RTX 4090 laptops on frame rate is largely a waste of effort. Choose on price, screen, weight, storage, support and — if the second display matters to you — features nothing else offers. The performance differences within a GPU tier are real but small, and they are swamped by everything else in the decision.
Against the Asus ROG Strix Scar 17 — RTX 4090 — behind by 34fps across three games
The one machine in the set that beats it, and by 34fps across three shared games — from the same manufacturer, with the same GPU tier.
Thirty-four frames is a small proportional gap against averages that run into the hundreds, but it is not nothing, and it is worth asking where it comes from. The Scar 17 carries a Ryzen 9 7945HX3D — the 3D V-Cache variant of the same processor family, with a large stacked cache that disproportionately helps in exactly the CPU-bound titles that dominate a three-game 1080p comparison. This machine has the standard 7945HX. That is the most plausible single explanation for the gap, and it fits the evidence: a difference that appears in processor-limited testing is most likely a processor difference.
What we cannot do is attribute it to power limits, because our record holds no TGP for the Scar 17. The Duo's 175W is confirmed; the Scar's is unknown. If the Scar turns out to run its 4090 above 175W, some of the gap is explained by that instead. If it runs at or below 175W, the processor explanation strengthens considerably.
Either way, the Scar 17 is a 17.3in machine weighing 2.935kg with no second display. It is a different proposition, and 34fps on averages of this size is not the reason to choose between them.
Reading the spread
Ahead by 109 against a well-configured 4050, ahead by one against a 4060, level with another 4090, behind by 34 against a 4090 with a cache-heavy processor. Lay those out and the structure of the market is visible.
The GPU tier is the dominant variable, but only in tests broad enough or heavy enough to expose it. Within a tier, implementations cluster. And the processor matters more than most buyers expect, because a large fraction of benchmark results at 1080p are decided by it rather than by the graphics card.
For this machine specifically, the conclusion is that its performance is exactly what the specification promises and is essentially interchangeable with other RTX 4090 laptops. If you are buying it, you are buying it for the panel, the storage, the second display and the confirmed 175W — not for a frame rate advantage that does not exist.
Who it's for
The buyer with a genuine use for the second screen. This is the whole argument and it is worth being blunt about. If you stream, edit video, produce music, monitor systems, or simply work with reference material constantly open, a second display built into the machine is a workflow change rather than a gimmick, and no conventional laptop offers it. If that describes you, the weight and the keyboard position are prices worth paying and there is very little competition. If it does not describe you, buy something else — you would be paying for hardware you will switch off.
The buyer who wants a confirmed power limit. This is a smaller point that deserves more weight than it usually gets. Our record holds 175W for this machine's GPU and holds nothing for several of its rivals. When you buy a laptop with a stated TGP, you know what you are getting; when you buy one without, you are trusting that the unit you receive matches the unit that was reviewed. At this level of spending, that certainty is worth something.
The buyer who wants a Mini LED display without OLED's compromises. High peak brightness, deep blacks from local dimming, no burn-in risk from static elements. For a machine that will display the same interface for long stretches — which a dual-screen productivity machine certainly will — that combination is the sensible one, and Mini LED is not common at this size.
The buyer who plays demanding single-player games at the panel's native resolution. An RTX 4090 at 175W is one of the few configurations in this generation with the headroom to drive 2560x1600 natively in heavy titles. The measured 1080p figures — nothing below 118fps across eleven games — indicate a very large reserve to spend on resolution.
The buyer who keeps a large game library installed. The 2TB SSD is not glamorous but it is one of the specifications you will appreciate most often.
Who should buy something else
Anyone who plays mostly lighter or competitive titles. The Legion 5 comparison is the evidence and it is unusually stark: an RTX 4060 at 115W matched this machine across three shared games. If those are the games you play, you would be spending a very large sum for a difference of one frame. Buy a mid-range machine and a good monitor.
Anyone who doesn't have a use for the second display. Strip it out and you are left with a 2.666kg 16in laptop whose performance is interchangeable with other RTX 4090 machines. Several of those weigh less, cost less, or offer a larger main screen for similar mass. The Duo's case rests entirely on the feature our record cannot describe to you.
Anyone who types for long periods without an external keyboard. A second display in the palm-rest area pushes the keyboard forward and removes the wrist rest. That is an ergonomic change, not a neutral one, and it affects long typing sessions considerably. If the machine is going to be a primary writing tool used on its own keyboard, this is a real objection.
Anyone who needs the fastest RTX 4090 laptop available. The Strix Scar 17 comparison shows this is not it, by 34fps across three games. That is a small margin and not a good reason to choose between machines on its own — but if maximum frames is genuinely the criterion, this is not the machine the data points to.
Anyone who needs a value judgement before committing. We hold no confirmed UK price for this configuration and will not speculate about one, which is why this page carries no score. At the top of the range, where several machines produce statistically identical frame rates, the price is very often the entire argument — and it is the one variable this page cannot supply.
What we hold, and what we don't
Our record for this machine holds the GPU and its 175W power limit, the processor, memory, storage, main screen size, resolution, refresh rate and panel technology, weight and battery capacity, plus eleven measured game results from Notebookcheck at 1920x1080 on High with upscaling disabled.
It does not hold a confirmed UK price, any specification at all for the second display, any native-resolution frame rates, any battery-life measurement, any display brightness, contrast or local-dimming zone data, and no thermal or acoustic measurements.
Three of those gaps matter here. The second display is the machine's defining feature and we can tell you nothing about it, which is a meaningful limitation on this page in particular. The absence of 1600p figures means the headline numbers describe a workload roughly half as heavy as the machine's own panel presents — though with this much GPU headroom that is less damaging than it would be elsewhere. And the absence of a price means there is no value verdict here, only an account of how fast the machine is and against what.
The benchmark set itself also has an age limitation worth naming: it dates from early 2023, and the heaviest titles released since are not in it. The lowest measured figure is 118fps in a processor-bound flight simulator. That tells you nothing found this GPU's ceiling, which is encouraging — but it is not the same as knowing where the ceiling is.