Review
Asus ROG Strix G18 review
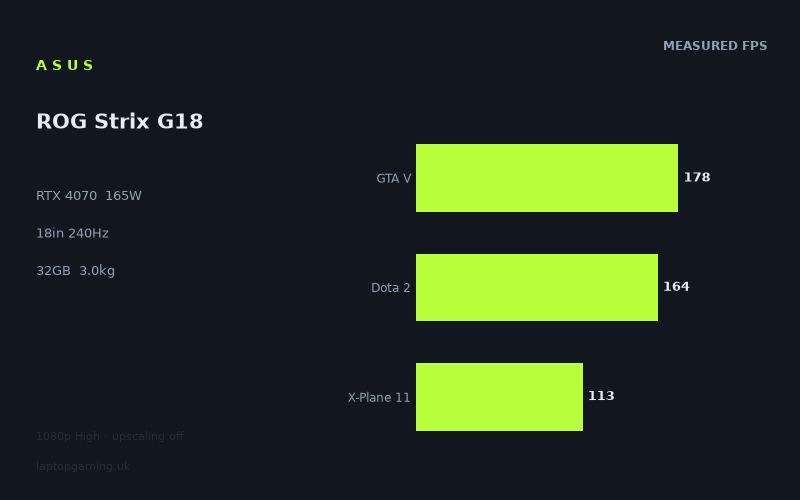
Frame rates
1920×1080, High preset, upscaling off.
Measured on this machine. Source: Notebookcheck, 2023-03-08.
Not scored: incomplete benchmark suite
Every scored laptop on this site is averaged over the same 5 games, and this one is short of Cyberpunk 2077, Baldur's Gate 3. A mean over 3 games is not comparable to a mean over 5, so we publish the figures we have and leave the score blank rather than rank it against machines tested on a different set. The numbers below are real - the suite is just incomplete.
How these numbers were produced
Frame rates here are not measured by us, and we label how each one was arrived at. A figure marked measured comes from a published run on that exact machine. A figure marked representative is derived from the GPU and its power limit (TGP) and cross-referenced against published reviews - a sound estimate of what that configuration delivers, but not a measurement of that specific laptop. Unless stated otherwise, numbers are 1920x1080, High preset, upscaling off. Where a laptop ships in several power configurations we use the wattage of the exact SKU listed, because a 140W RTX 5070 and a 115W one are not the same product.
In use
The short version
The Asus ROG Strix G18 is what happens when a manufacturer puts a mid-to-upper graphics card into a chassis big enough to stop apologising for it. The GPU is an RTX 4070 running at a 165W total graphics power limit, which is a high allocation for that part, and it sits in an 18in body weighing 2.972kg. Alongside it are a Core i7-13650HX, 32GB of memory and a 1TB SSD, driving a 2560x1600 IPS panel at 240Hz.
The measured evidence is unusually deep. Notebookcheck published twenty-six games for this machine on 8 March 2023, all at 1920x1080 on the High preset with upscaling switched off. That is one of the richest data sets we hold for any laptop, and it lets you see the machine's behaviour rather than infer it from four or five results. The range runs from 245fps in Strange Brigade at the top to 60fps in Elden Ring at the bottom — and, as the performance section explains, that bottom figure is not what it appears to be.
The verdict is straightforward. This is a well-fed RTX 4070 doing exactly what a well-fed RTX 4070 should do, in a chassis that gives it the cooling to sustain it. Nineteen of the twenty-six measured titles are above 120fps. The genuine graphics floor across the whole set is 66fps, in A Plague Tale Requiem, and that is with settings high and no upscaling. For a machine of this era it is a strong, consistent result with no obvious weak spot in the performance profile.
The reservations are about shape rather than speed. At 2.972kg with an 18in footprint, this is a portable desktop, not a laptop you carry casually. The 240Hz panel is far ahead of what the graphics card can supply in most of the suite. And the processor is an i7 rather than the i9 parts found in some competitors, which shows up in a specific and identifiable place in the data.
Performance
What 165W buys, and why the chassis matters
Mobile graphics cards of this generation carried the same model name across a very wide range of operating conditions, and the power limit is the specification that actually determines behaviour. 165W is at the top end of what an RTX 4070 was given in a notebook, and the reason this machine can carry that limit is sitting right there in the weight and the screen size.
Cooling capacity is a function of volume, fan area and heat-pipe run. An 18in chassis at 2.972kg has all three in abundance. A graphics card allowed 165W plus a high-core-count processor under simultaneous load produces a great deal of heat, and there are only two ways to handle it: move it, or reduce it by cutting the power limit. Thin machines take the second option because they have no choice. This one takes the first.
The practical difference is not the peak number in a thirty-second benchmark run. It is what happens in the second hour of a session, when everything has reached its steady state and the machine has to decide whether to hold its clocks or back off. A GPU running comfortably within a generous envelope holds. One that is fighting its cooling does not. We have no measured thermal or acoustic data for this laptop, so we cannot show that directly — but the combination of an 18in body and a 165W ceiling is the configuration most likely to deliver it, and the shape of the results is consistent with a card that is not being starved.
The evidence for that is in the bottom half of the chart rather than the top. Light games run fast on almost anything. Heavy games are where a constrained implementation falls away, because they demand every available watt in every frame. When a machine records 143fps in Hogwarts Legacy, 130fps in Deathloop and 104fps in Returnal — all demanding titles at the time these figures were taken — the graphics card is clearly being allowed to work.
Elden Ring at 60fps, and why it is not a limitation
The lowest number in this data set is Elden Ring at 60fps, and it is the most misread figure on the whole chart.
Elden Ring is capped at sixty frames a second by its own engine. That cap applies regardless of hardware. A machine three times as fast as this one records the same figure, because the game will not produce more frames no matter what you give it. The 60fps result here is therefore not a measurement of the RTX 4070 at all; it is a measurement of a software ceiling that every machine in existence shares.
This matters for two reasons. First, anyone scanning a benchmark chart for the lowest number and treating it as the machine's worst case will get this laptop badly wrong. Second, and more usefully, it tells you something reassuring: the machine hits the cap. A slower system would fall below it in heavy areas, and the fact that this one records the cap cleanly means it has margin in hand.
The real graphics floor in this suite is one place higher: A Plague Tale Requiem at 66fps. That is an uncapped, genuinely expensive title, and 66fps at High with upscaling off is the honest worst case. It is also the number to plan around, because it is the one that predicts how the machine will handle software of that weight in future.
The top of the chart
Four titles sit above 178fps: Strange Brigade at 245fps, The Witcher 3 at 237fps, Back 4 Blood at 221fps and Vampire Bloodhunt at 200fps.
These are the numbers that get quoted and the numbers that tell you least. Strange Brigade is a benchmarking staple because it is repeatable and engine-friendly, not because anyone is choosing a laptop for it. The Witcher 3 is a 2015 title. Back 4 Blood and Vampire Bloodhunt are both built for high frame rates by design.
Their value is contextual: against a 240Hz panel, these four are the titles where the screen becomes the limiting factor rather than the machine, and where the refresh rate genuinely earns its place. If your play is dominated by fast multiplayer games with modest graphics demands, this is the part of the chart that applies to you, and it says the panel will be the constraint rather than the hardware.
The dense middle, and what it says about consistency
What distinguishes this data set from most is how thickly populated its middle is. Between 104fps and 178fps sit no fewer than nineteen titles: GTA V at 178fps, Ghostwire Tokyo at 172fps, Dota 2 at 164fps, Company of Heroes 3 and Days Gone both at 155fps, Far Cry 5 at 154fps, Halo Infinite at 149fps, Farming Simulator 22 at 148fps, Guardians of the Galaxy at 147fps, Outriders at 145fps, Hogwarts Legacy at 143fps, Riders Republic at 135fps, High On Life at 132fps, Deathloop at 130fps, The Quarry at 122fps, Elex 2 at 118fps, Final Fantasy XV at 116fps, X-Plane 11 at 113fps, Need for Speed Unbound at 110fps and Returnal at 104fps.
That is an extraordinarily flat distribution for such a varied set of software. Farming Simulator 22 and Hogwarts Legacy are not remotely similar workloads, and they land five frames apart. Halo Infinite, Guardians of the Galaxy and Outriders — three different engines, three different studios, three different eras — are all within four frames of each other.
A flat distribution across a wide range of software is a good sign, and it means something specific: the machine has no characteristic weakness. Some laptops are fine until they meet a title with heavy streaming, or heavy geometry, or a lot of simultaneous lighting, and then fall over. There is no evidence of that here. Whatever kind of work these twenty-six games represent, this machine handles it at broadly the same rate.
The one result in that band worth singling out is Dota 2 at 164fps. Dota 2 is among the lightest titles in the suite by a wide margin, and it lands below Ghostwire Tokyo and only slightly above Company of Heroes 3. It is not being limited by the graphics card — nothing about Dota 2 troubles an RTX 4070 at 165W. It is being limited by how fast the processor and the engine can prepare frames, and the Core i7-13650HX is a step down from the i9-class parts found in some machines of this generation. If your play is dominated by competitive titles that run at very high frame rates, that is the specification to think about, not the graphics card.
Where the spread comes from
Set aside the software-capped Elden Ring result and the honest range here is 245fps to 66fps — a factor of about three and a half on identical hardware at identical settings. Three things account for it.
The first is simply how much work each game asks for per frame. A Plague Tale Requiem's crowd rendering and lighting are in a different league from Back 4 Blood's, and no amount of hardware changes that ratio.
The second is where the limit sits. In the top quarter of this chart the graphics card is finishing frames and waiting on the processor; in the bottom quarter it is saturated. Those are two different measurements with the same units, and averaging across them — which any single headline figure necessarily does — conceals a real distinction.
The third is engine behaviour that has nothing to do with either. Elden Ring's cap is the clearest example, but X-Plane 11 at 113fps is another: flight simulators of that vintage are dominated by single-thread processor performance and scenery streaming, not shader throughput, and its position in the chart reflects the platform rather than the graphics card.
Why there is no overall score
Every laptop we score is averaged over the same five games so that leaderboard positions mean something. For this machine we have three of them — GTA V at 178fps, Dota 2 at 164fps and X-Plane 11 at 113fps, averaging 152fps — and no figures for Cyberpunk 2077 or Baldur's Gate 3.
There is a particular problem with publishing a partial average here. The three titles we hold are precisely the ones least limited by the graphics card, and one of them, Dota 2, is visibly constrained by the processor. A three-game average built on that set would tell you more about the i7-13650HX than about the RTX 4070, and it would place the machine against rivals whose five-game averages include two genuinely graphics-limited titles. That is not a like-for-like comparison, so we do not make it.
The twenty-six games above are a far better guide than a truncated score would be. They just are not a ranking.
The screen
An 18in IPS panel at 2560x1600 and 240Hz is a generous specification, and it is generous in a way that outruns the graphics card in most of the suite.
Take the good parts first. 18in is a great deal of usable area — noticeably more than the 16in machines that dominate this market — and at 2560x1600 in a 16:10 aspect ratio, the pixel density is high enough that the extra size does not come at the cost of sharpness. For anything that is not a game, an 18in 1600p display is a genuinely productive workspace, and it is one of the main reasons to choose a machine this size. IPS at this diagonal is the sensible technology choice: viewing angles hold up across a screen wide enough that the corners are at a meaningfully different angle from the centre.
Now the arithmetic. Four of twenty-six measured titles exceed 240fps-worth of headroom at 1920x1080. Everything else is below the panel's refresh rate before you have even accounted for resolution — and you do have to account for it, because 2560x1600 carries roughly seventy-eight per cent more pixels than the resolution these figures were recorded at. In any title that is genuinely graphics-limited, native-resolution frame rates will be materially below the numbers above.
That does not make the panel a mistake. Resolution and refresh rate serve different parts of your library, and it is normal for neither to be fully exploited at once. The 240Hz refresh rate is there for competitive titles, where frame rates are high and the resolution burden is low; the 2560x1600 resolution is there for single-player games and for everything you do outside games. The panel does both jobs; the graphics card can serve one at a time.
The practical arrangement most owners will land on is the sensible one: run demanding single-player titles at native resolution with upscaling enabled and accept a frame rate well short of 240, and run competitive titles at whatever combination keeps you above the refresh rate. Both are good outcomes. What the data does not support is an expectation of 240fps at 2560x1600 in anything other than the very lightest software.
We hold no measured panel data for this machine — brightness, contrast, colour coverage and response time are all absent from our figures. A 240Hz specification describes the refresh interval, not how quickly individual pixels settle, and those are different things. If image quality rather than raw speed is your deciding factor, this review cannot settle it.
Build, size and portability
At 2.972kg and 18in across, the Strix G18 is a desktop replacement, and the most useful thing anyone can tell you about it is to treat it as one.
The consequences are concrete. An 18in laptop does not fit on an aircraft tray table or comfortably on a train table. It needs a large backpack, not a normal one. And the 2.972kg figure excludes the power supply, which for a machine feeding a 165W graphics card alongside a Core i7-13650HX is a substantial object in its own right. Anyone moving this machine is moving a considerable load, and doing it daily would become tiresome quickly.
What you get in return is the performance profile described above. The 165W power limit is not a marketing figure that the chassis cannot honour; it is an allocation that this much cooling volume makes plausible. Machines carrying the same graphics card in 14in and 16in bodies almost invariably run it at lower limits, because there is nowhere for the heat to go. The size is not incidental to the frame rates. It is the reason for them.
There is also a quality-of-life argument for 18in that gets overlooked. A larger chassis usually means a full-size keyboard layout with a proper number pad, more room for ports along the sides and rear, and fans that can move a given volume of air at lower speed — which tends to mean lower-pitched, less irritating noise, though we have no measured acoustic figures to confirm it here. For a machine that is going to live on a desk, those are real daily benefits.
The 90Wh battery is a reasonable capacity, though not the largest available in this class. On a machine of this power draw it is best understood as provision for the non-gaming half of the machine's life — browsing, video, document work — rather than as a route to meaningful unplugged gaming, which no laptop at this power level delivers. We hold no measured runtime figures, so we will not put a number on any workload.
The 1TB SSD is the one specification here that looks a little tight for the class. Modern game installations are enormous, and a machine capable of playing everything in a twenty-six-title suite will fill 1TB faster than its owner expects. Storage is usually the easiest thing to add later, but it is worth budgeting for.
How it compares
Four machines from the same graphics generation give the spread. Every comparison here is drawn from three shared games, which is a small sample, and that constraint shapes what these numbers can and cannot tell you.
Against the MSI Thin GF63 (RTX 4050)
Across three shared games the Strix G18 averages 64fps more than the MSI Thin GF63. That is by far the widest gap in this set, and its size is what makes it informative.
Three shared games is a narrow basis for comparison, and as the results below demonstrate, narrow bases usually compress differences rather than exaggerate them. When a comparison built on such a set still produces a 64-frame average gap, the underlying difference in capability is not marginal. A 165W RTX 4070 in an 18in chassis and an RTX 4050 in a thin, inexpensive one are separated by enough that even the least discriminating test conditions cannot hide it.
For a buyer, the interpretation is simple: these two machines are not really competing. If both are on your shortlist, the shortlist is a budget question rather than a specification question, and the frame rate gap makes the cost of the budget decision unusually legible.
Against the HP Omen 16-wf000 (RTX 4080)
Across three shared games these two machines are level to within a frame — and the Omen has an RTX 4080 in it.
Taken at face value that would say a 165W RTX 4070 matches an RTX 4080, which is not true. What it actually says is that the three shared titles are not testing the graphics card. They are drawn from the scoring suite, and as established above, those particular games at 1920x1080 are limited by processor and engine throughput rather than by shader performance. Both machines run out of processor before they run out of graphics card, so both stop in the same place.
This is genuinely useful information, but only for a specific buyer. If your library looks like the light end of this chart — competitive shooters, older titles, high frame rates — then the tie is real and relevant, and you would gain nothing from the more expensive graphics card. If your library looks like A Plague Tale Requiem, the tie tells you nothing at all, because the conditions that produced it never arise in the games you play.
Against the HP Omen Transcend 16-u1095ng (RTX 4070)
Across three shared games the Strix G18 averages 1fps less than the Omen Transcend. That is a dead heat between two machines carrying the same graphics card, and it is the least surprising result in the set.
The interesting angle is what it says about chassis. The Omen Transcend is a 16in machine; this is an 18in one carrying a high power limit. On the three shared titles — which, again, are the processor-limited ones — the extra cooling capacity buys nothing, because the graphics card was never the constraint.
The conclusion is not that the two machines are equivalent, but that this comparison cannot separate them and should not be used to try. Where they would separate is in the heavy titles at the bottom of the twenty-six-game chart, and we do not have shared figures there. What we do have is enough to say that a buyer choosing between these two should decide on size, weight, panel, ports, noise and price, because the available frame rate evidence does not favour either.
Against the Asus ROG Strix Scar 17 (RTX 4090)
Across three shared games the Strix G18 averages 47fps less than the Scar 17. This is the machine at the top of the comparison set, and the gap is substantial even on a test basis that compresses differences.
That last clause is the key to reading it. If three lightly-loaded, processor-limited titles were enough to produce a tie between this machine and an RTX 4080 laptop, the fact that the same three titles produce a 47-frame gap against the Scar 17 means something real is happening. It suggests the Scar's advantage in exactly the conditions where graphics cards do not matter — which points at the rest of the platform rather than the GPU. In graphics-limited titles the gap would be there too, for different reasons and probably in a different size, but we do not hold shared figures to demonstrate it.
For a buyer, the honest summary is that the Scar 17 is a faster machine in the conditions these three games represent, and that the two are not competing for the same money or the same use anyway. What the comparison usefully establishes is the top of the scale, so that the other margins can be read against something.
Reading the four together
Lined up, the pattern is coherent. A wide win over an entry-level card. A dead heat with a machine one graphics tier up. A dead heat with a machine carrying the identical card. A meaningful loss to a flagship. Three of those four are decided by the processor rather than the graphics card, because the shared-game set is the processor-limited one.
That is not a defect in the data; it is the data being honest about what it measured. But it means a buyer should read these margins with the shared-game count in mind every time. The safest general conclusion is the one supported by the twenty-six-game chart rather than by any of these three-game deltas: this machine's graphics performance is strong, consistent and free of weak spots, and its processor is the component most likely to set the ceiling in lightweight, very-high-frame-rate titles.
Who it's for
This suits someone who wants a large-screen machine that plays everything well and lives mostly in one place. An 18in 1600p display, 32GB of memory and a 165W RTX 4070 is a coherent set of choices for a person whose laptop is really a desktop that occasionally moves. Nineteen titles above 120fps and a genuine graphics floor of 66fps is a broad, dependable performance profile, and the flatness of the distribution means there is no category of game that catches it out.
It suits someone who values screen area over portability. This is a real preference and an underserved one. If you work in multiple windows, edit timelines, or simply want games to fill more of your vision, 18in delivers something no amount of graphics performance can, and the 2560x1600 resolution means it does so without looking coarse.
It suits a buyer who wants a graphics card running at its designed ceiling rather than a nominally superior one that has been starved. The 165W limit is the single most consequential number in the specification, and the chassis is what makes it credible. Machines that carry higher-tier cards at lower power limits routinely lose to configurations like this one in sustained load, and the heavy titles in this chart are where that shows.
Who should buy something else
Anyone who carries a laptop regularly. 2.972kg plus a large power brick, in an 18in footprint, is not a commuting machine and no amount of performance changes it. If you are on a train twice a week you will resent it within a month, and there are 16in machines with similar graphics capability that would suit you far better.
Anyone buying primarily for competitive gaming at very high frame rates. The Dota 2 result at 164fps is the tell: in that class of software the Core i7-13650HX, not the graphics card, is what sets the ceiling. A machine with a higher-tier processor would serve you better, and would cost you nothing in the graphics-limited titles where this one is strong.
Anyone expecting the panel's 240Hz to be met at native resolution. It will not be, in anything but the lightest titles. That is not a fault — it is normal for this class — but if the 240Hz figure is what is attracting you, be clear that in twenty-two of the twenty-six measured games the machine is already below it at a lower resolution than the panel's own.
Anyone who needs a ranked position before committing. We hold no Cyberpunk 2077 or Baldur's Gate 3 figures for this machine, so it cannot be placed on our scored leaderboard. Given that the three scoring titles we do have are the least graphics-limited games in the suite, a partial average would have misrepresented it. The twenty-six-game picture above is the better evidence, and we would rather argue from it than publish an incomplete number.
The bottom line
The ROG Strix G18 is a properly engineered example of a common idea: a mid-to-upper graphics card given a large chassis and the power budget to use it. The twenty-six-game data set shows the result — a flat, consistent distribution with no characteristic weakness, a genuine floor of 66fps in the hardest title measured, and a software-capped 60fps in Elden Ring that says nothing about the hardware. The processor is the one component that shows its limits, and it shows them in exactly the lightweight, high-frame-rate titles where the 240Hz panel would otherwise be most useful. If you want the screen and can accept the weight, the performance side of the argument is settled in this machine's favour.