Performance analysis
Cyberpunk 2077 1.0: what it takes to run it
Measured on 17 gaming laptops at 1920×1080, High preset, upscaling off.
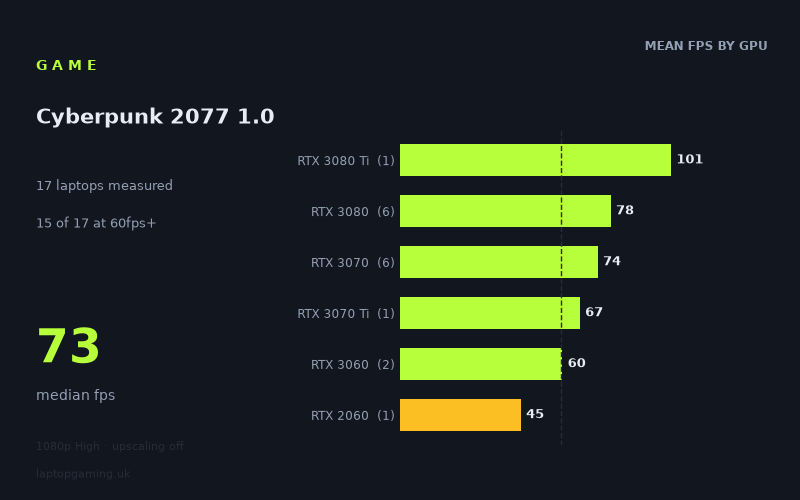
Every laptop we have figures for
Frame rates measured by Notebookcheck.
What it asks of a laptop
At 1,920 x 1,080 on the High preset with upscaling off, Cyberpunk 2077 1.0 is demanding but not unmanageable for the gaming laptops in this sample. Notebookcheck’s measured figures cover 17 laptops, ranging from 45fps to 101fps, with a median result of 73fps. That is a substantial 56fps gap between the slowest and fastest machines, so GPU choice and, in several cases, the laptop’s power configuration clearly matter.
The encouraging headline is that 15 of the 17 measured laptops reached at least 60fps. For a 60Hz laptop display, or for players who value a stable, conventional target rather than very high refresh-rate performance, the tested machines suggest that an RTX 3060-class GPU or better is generally the useful starting point. However, “generally” matters here: the RTX 3060 results were 63fps and 58fps, so this tier sits close enough to 60fps that the individual laptop still makes a difference.
The results also show that this is not an easy game to drive at the highest laptop-display refresh rates under these conditions. Only one machine reached 100fps, while none reached 144fps. The fastest result, 101fps from the MSI GE76 Raider with an RTX 3080 Ti running at 175W, was 43fps short of 144fps. A laptop with a 144Hz panel can still run the game well, but the measured figures do not support expecting the High preset at native 1080p without upscaling to fill that panel consistently.
There is a noticeable but not perfectly tidy separation between GPU tiers. The RTX 3080 group averaged 78fps across six laptops, compared with 74fps across six RTX 3070 laptops. That relatively narrow gap is important: the fastest RTX 3080 result was 92fps, but another RTX 3080 laptop returned 68fps. Meanwhile, RTX 3070 results ran from 62fps to 82fps. The figures point to laptop implementation being highly relevant alongside the GPU label.
What runs it
RTX 3080 Ti: There is only one result in this tier, so it should not be treated as a broad verdict on every RTX 3080 Ti laptop. The MSI GE76 Raider, with a 175W RTX 3080 Ti, delivered 101fps. It is the only measured machine to reach 100fps, but it did not reach 144fps.
RTX 3080: The six measured RTX 3080 laptops averaged 78fps. All six exceeded 60fps, with results of 92fps for the Alienware m17 R4, 84fps for the Schenker XMG Neo 15 Tiger Lake with a 165W RTX 3080, 82fps for the Aorus 15P YD with a 130W RTX 3080, 75fps for the Gigabyte Aero 17 HDR YD, 70fps for the Asus ROG Zephyrus G15, and 68fps for the Gigabyte Aero 17 HDR YC. This is the strongest tier with enough measured examples to show a range, rather than a single result. It is a reliable 60fps class in this sample, but none of these RTX 3080 laptops reached 100fps.
RTX 3070: Six RTX 3070 laptops averaged 74fps, only 4fps behind the RTX 3080 average in Notebookcheck’s figures. Results ranged from 82fps on the Schenker XMG Neo 17 and 81fps on the Lenovo Legion 5 Pro 16ACH6H, down to 62fps on the MSI Katana GF66 with an 85W RTX 3070. The Gigabyte A7 X1 reached 77fps, the Asus ZenBook Pro Duo UX582 with an 85W RTX 3070 reached 73fps, and the Gigabyte Aero 15 OLED XD reached 67fps. Every measured RTX 3070 laptop cleared 60fps, but none reached 100fps.
RTX 3070 Ti: The sole RTX 3070 Ti result was 67fps from the MSI Stealth GS66. That clears 60fps, but one laptop is too small a sample from which to make a wider claim about the tier.
RTX 3060: This is the closest tier to the 60fps line. The Alienware m15 R5 Ryzen Edition, equipped with a 125W RTX 3060, managed 63fps. The Acer Aspire Nitro 5 with an RTX 3060 recorded 58fps. The two-laptop average is exactly 60fps, but the individual results show that it is not a tier with much headroom under these test conditions.
RTX 2060: The HP Omen 15-en0375ng returned 45fps. This is the only RTX 2060 figure, but it is the lone measured laptop below 58fps and well below the 60fps target.
The cheapest laptop that handles it
Only two prices are supplied in the fact sheet, so it would be inaccurate to call any machine the cheapest of all 17 laptops. The lowest-priced laptop with a stated price is the MSI Katana GF66 at £515. Its 85W RTX 3070 produced 62fps, clearing 60fps by a narrow 2fps margin.
The other priced model is the Asus ROG Zephyrus G15, listed at £2,196 with an RTX 3080. It achieved 70fps. The MSI Stealth GS66, listed at £2,688 with an RTX 3070 Ti, recorded 67fps. On these supplied figures, the £515 Katana is not merely cheaper than those two alternatives; it is also close enough in performance to underline how much overlap there is between laptop GPU tiers in this data.
What this means if you’re buying
If 60fps at 1080p High without upscaling is the goal, the measured figures make an RTX 3070 laptop the safer choice: all six tested examples cleared 60fps, from 62fps to 82fps. RTX 3080 laptops offered stronger results overall, but their 68fps-to-92fps spread means the badge alone does not guarantee a dramatic gain over a good RTX 3070 machine.
An RTX 3060 laptop can be sufficient, but the 58fps and 63fps results make it a less comfortable purchase for this specific target. For 100fps, the sample offers only one proven option: the MSI GE76 Raider with its 175W RTX 3080 Ti, at 101fps. For 144fps, there is no proven option among these 17 laptops at these settings. Buy for the measured class of performance you need, rather than assuming that a higher-numbered GPU will automatically translate into a proportionate frame-rate lead.
How these numbers were produced
Frame rates here are not measured by us, and we label how each one was arrived at. A figure marked measured comes from a published run on that exact machine. A figure marked representative is derived from the GPU and its power limit (TGP) and cross-referenced against published reviews - a sound estimate of what that configuration delivers, but not a measurement of that specific laptop. Unless stated otherwise, numbers are 1920x1080, High preset, upscaling off. Where a laptop ships in several power configurations we use the wattage of the exact SKU listed, because a 140W RTX 5070 and a 115W one are not the same product.