Review
Acer Nitro v 17 (ANV17-41-R4CJ) review
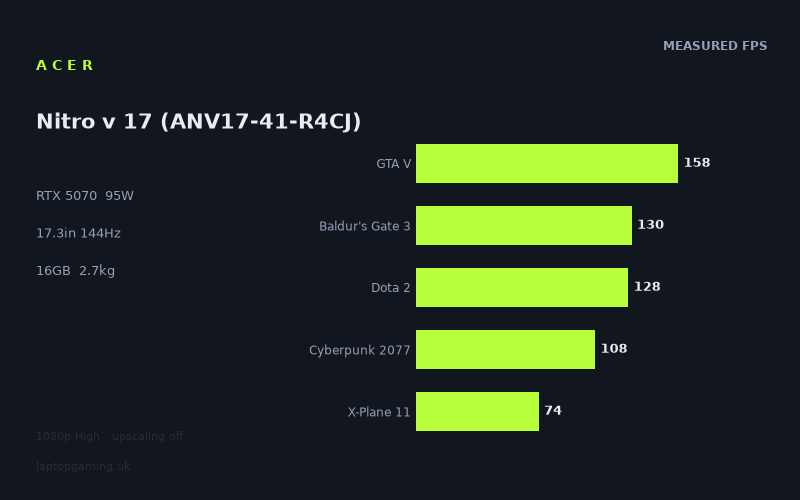
Frame rates
1920×1080, High preset, upscaling off. Averages 119fps across the 5 core benchmark games.
Measured on this machine. Source: Notebookcheck, 2026-01-21.
Not scored: no confirmed UK price
We have the full benchmark suite for this machine, so it ranks on the frame rate leaderboard like any other. What we don't have is a UK listing for this exact configuration - it's sold as a European review unit, or only in specifications that differ from the one tested. Since 30% of our score is value for money, scoring it would mean pretending price is no object, which would flatter it against every laptop you can actually buy. The frame rates below are real and comparable; there is just no buying recommendation to make yet.
How these numbers were produced
Frame rates here are not measured by us, and we label how each one was arrived at. A figure marked measured comes from a published run on that exact machine. A figure marked representative is derived from the GPU and its power limit (TGP) and cross-referenced against published reviews - a sound estimate of what that configuration delivers, but not a measurement of that specific laptop. Unless stated otherwise, numbers are 1920x1080, High preset, upscaling off. Where a laptop ships in several power configurations we use the wattage of the exact SKU listed, because a 140W RTX 5070 and a 115W one are not the same product.
In use
The short version
The Acer Nitro v 17 (ANV17-41-R4CJ) is a large-screen mid-range gaming laptop whose character is set by two decisions made before anything else about it matters. The first is that its RTX 5070 is held to a 95W total graphics power limit. The second is that the GPU has an 8GB frame buffer. Everything else on the specification sheet - the Ryzen 7 260, 16GB of memory, a 512GB SSD, a 17.3in 1920x1080 144Hz IPS panel, 2.698kg on the scales and a 76Wh battery - sits downstream of those two numbers.
The measured frame rates say the combination works at the resolution it was built for. Across the five games in our scoring suite the machine averages 120fps at 1920x1080 on the High preset with upscaling switched off. That is a genuinely strong result for a 1080p panel: it means the typical demanding game runs comfortably above 60fps with headroom left over, and several run fast enough to make real use of a 144Hz display. The measurements were taken by Notebookcheck on 21 January 2026, and they span an unusually wide range - from 259fps in Strange Brigade down to 69fps in Doom: The Dark Ages.
The interesting part of this machine is not the average, though. It is what the rival data does to the story you would expect to tell about a power-limited GPU. Against a Razer Blade 14 running the same RTX 5070 at 115W, the average difference across the five games both machines hold is nil. Against a Schenker XMG Core 16 M25, also an RTX 5070, the average difference across five shared games is also nil. Two independent machines with the same GPU, one of them with 20W more graphics power to play with, and the benchmark data cannot separate any of them. That result needs explaining rather than celebrating, and the explanation is the most useful thing in this review.
The rest of the comparison set puts the machine's position beyond doubt. It averages +31fps over the MSI Cyborg 15 and its RTX 5050 across five shared games - the tier below is measurably, consistently slower. And it averages -81fps against the Schenker XMG Neo 16 A25 and its RTX 5090 across five shared games - the tier above is measurably, enormously faster. Those two results matter enormously, because they prove the test conditions still have the resolving power to show real differences. When a measurement that can find an 81fps gap and a 31fps gap reports nothing between three RTX 5070 machines, that nothing is a finding.
Buy it if you want a big 1080p screen and steady frame rates in demanding games without paying for the tier above. Look elsewhere if you intend to run above 1920x1080, if you plan to keep the machine for many years and expect it to swallow whatever gets released in that time, if you actually carry a laptop around rather than move it between rooms, or if the words "RTX 5070" have set an expectation that a 95W ceiling in a 2.698kg chassis was never going to meet.
Performance
What a 95W graphics power limit actually does
The single most misunderstood number on a gaming laptop specification sheet is the graphics power limit. It is worth being precise about the mechanism, because the vague version - "lower watts, lower frames" - leads people to the wrong conclusions in both directions.
A laptop GPU operates under two separate ceilings at once. There is a clock ceiling: the highest frequency the silicon is permitted to run at, set by the design and the cooling. And there is a power ceiling: the total wattage the chip is allowed to draw, which here is 95W. At any given instant the GPU runs as fast as it can while staying under both. Which ceiling is actually binding depends entirely on how hard the scene in front of it is working the chip.
In a light scene - a simple menu, an older engine, a sparsely populated map, a title that leans heavily on the CPU rather than the graphics processor - the GPU does not draw anything close to its permitted wattage. The clock ceiling is the constraint, and the power limit is doing precisely nothing. A machine with a 95W limit and a machine with a 115W limit behave identically, because neither is anywhere near either figure.
In a heavy scene - dense geometry, ray-traced lighting, high-resolution textures, a lot of simultaneous shader work - the chip's power draw climbs fast. Once it reaches the ceiling, the GPU has no choice but to lower its clock frequency until draw fits the budget. Now the power limit is the binding constraint, and the machine with more headroom holds a higher clock and produces more frames.
The consequence is important and frequently missed: a low power limit is not a flat tax on performance. It is a tax that grows with the size of the job. It costs nothing in the games that were never going to stress the chip, and it costs most in exactly the games where you would most like the extra performance. A power-limited GPU therefore looks better in an average across a broad suite than it does in the specific moments that make you wish you had bought something faster.
There is an honest counterweight, and it is the reason 95W parts are viable at all rather than a bad joke. Power consumption in a silicon chip scales super-linearly with clock frequency - pushing the clock higher costs disproportionately more watts for each additional megahertz, because you need more voltage as well as more switching activity, and the power cost rises faster than linearly with that voltage. Run the relationship backwards and the arithmetic turns friendly: taking watts away costs you far less frequency than it saves you power. Cutting a GPU's power budget by a third does not cut its frame rate by a third; it takes a modest bite out of clocks and a much smaller bite out of frames. This is why a 95W RTX 5070 is not a broken RTX 5070. It is a chip operating at a more efficient point on its own curve, giving up the last and most expensive slice of its performance in exchange for fitting inside a chassis with a manageable cooling system.
The difference at stake here is narrow anyway. The Razer Blade 14 in the comparison set runs the same GPU at 115W. That is 20W more, which is about 21 per cent more graphics power than this machine's 95W (20 divided by 95). Given a super-linear power curve, 21 per cent more watts was never going to translate into anything like 21 per cent more frames even in the games where the limit binds hardest. Keep that figure in mind for the comparison section, because it is the difference the benchmark data will fail to detect.
The measured numbers, and what shape they make
Here is the full set of measured results, all at 1920x1080, all on the High preset, all with upscaling switched off, all sourced from Notebookcheck on 21 January 2026:
- Strange Brigade - 259fps
- GTA V - 158fps
- F1 25 - 142fps
- Baldur's Gate 3 - 130fps
- Dota 2 - 128fps
- Final Fantasy XV - 123fps
- Cyberpunk 2077 - 108fps
- X-Plane 11 - 74fps
- Doom: The Dark Ages - 69fps
Five of those - GTA V, Baldur's Gate 3, Dota 2, Cyberpunk 2077 and X-Plane 11 - make up the scoring suite, and they average 120fps.
The first thing to take from that list is the sheer width of it. The top figure is 259fps and the bottom is 69fps. Divide one by the other and you get a spread of roughly 3.75x (259 divided by 69 = 3.75), on identical hardware, at an identical resolution, at an identical preset, with no upscaling anywhere to muddy the comparison. That is not a measurement problem. It is a statement about how little the phrase "runs games at 1080p High" actually pins down, and it is why a single headline frame rate for any laptop is close to meaningless without knowing which game produced it.
The useful way to read a spread like this is in groups, because the groups map onto different practical experiences.
Comfortably above the panel: Strange Brigade and GTA V
Strange Brigade at 259fps and GTA V at 158fps both exceed the 144Hz panel outright. Strange Brigade does so by a factor of about 1.8 (259 divided by 144). These are the results that tell you the machine is not short of raw capability at this resolution - given a well-optimised engine or an older title, the GPU produces more frames than the display can show.
Those extra frames are not entirely wasted. Rendering above the refresh rate still reduces the age of the image on screen when each refresh happens, which lowers perceived input latency, and it gives the system slack to absorb a difficult moment without the frame rate visibly dropping. But it does mean that in this group the panel, not the GPU, is what you are looking at. If your gaming diet is mostly competitive shooters and older engines, this machine has capability you will never see, and you would be paying for silicon that spends its life waiting.
It is also worth noting what Strange Brigade in particular represents. A result that far above everything else in the set is a well-optimised engine hitting a machine that suits it, and it should be read as the ceiling of what this hardware can do rather than as an indication of what it typically does. The gap between it and the next result down - 259fps against 158fps, a difference of 101fps - is larger than the gap between the second-place result and the bottom of the entire table.
At the edge of the panel: F1 25, Baldur's Gate 3 and Dota 2
F1 25 at 142fps, Baldur's Gate 3 at 130fps and Dota 2 at 128fps cluster just underneath the refresh rate. F1 25 is within 2fps of the 144Hz cap - about 99 per cent of it. Baldur's Gate 3 reaches roughly 90 per cent of the panel's capability, Dota 2 about 89 per cent.
This is arguably the best group on the sheet, because it is where the hardware and the display are closest to matched. Frame rates in this band feel fast, they use nearly all of what the panel can show, and they leave enough margin that ordinary variation in scene complexity does not drag the experience somewhere unpleasant. For a driving game where consistency of motion matters, and for a MOBA where input latency matters, results in the high 120s and above are exactly what you want from a machine at this tier.
Dota 2 sitting at 128fps also carries a quiet piece of information. It is not a demanding game for a modern GPU. When a title like that lands at 128fps rather than somewhere in the hundreds, the limit is very unlikely to be graphics throughput - it is far more likely to be the processor, the engine's own internal ceiling, or the frame-time overhead of getting work from the CPU to the GPU and back. That observation becomes important later, because it is the mechanism that explains the rival results.
The demanding middle: Final Fantasy XV and Cyberpunk 2077
Final Fantasy XV at 123fps and Cyberpunk 2077 at 108fps are the results most people should anchor their expectations to. These are heavier titles. They are comfortably clear of 60fps - Cyberpunk sits at about 75 per cent of the panel's 144Hz capability and Final Fantasy XV at about 85 per cent - but they are not filling the display, and no amount of arguing changes that.
Cyberpunk 2077 at 108fps is a good result for a mid-range machine and should be read as such. It is a genuinely punishing game, and 108fps at High with no upscaling assistance means the GPU is doing real work and doing it well. It is also the result that most directly demonstrates the power-limit argument from earlier: this is the sort of scene where 95W is genuinely the binding constraint, and where a machine with more headroom would hold higher clocks. The measured data cannot show us how much that would be worth here - Cyberpunk is in the scoring suite, but we do not hold the specific per-game rival figures, only averages across shared sets - so the sensible position is that the ceiling costs something in this group and nothing in the group above it.
The floor: X-Plane 11 and Doom: The Dark Ages
The two lowest results deserve separate treatment, because they are low for entirely different reasons and only one of them is a comment on the graphics hardware.
X-Plane 11 at 74fps is a processor story, not a GPU verdict. Flight simulators are notoriously heavy on the CPU - they are simulating flight models, weather, navigation data and vast quantities of scenery streaming, and much of that work lands on a small number of processor threads rather than on the graphics chip. A result of 74fps here tells you something real about the Ryzen 7 260 and about how the machine behaves in simulation workloads, and it is a perfectly usable number in a genre where nobody expects triple-digit frame rates. What it does not tell you is anything much about the RTX 5070 or its power limit. Read it as a simulator result, and if simulators are your main use, weight it accordingly - but do not fold it into a judgement about graphics performance.
Doom: The Dark Ages at 69fps is the number that matters most on the entire sheet, and it is the one to think hardest about. This is a current, graphically aggressive release, measured at the same 1080p High with upscaling off as everything else, and it lands at less than half the panel's refresh rate - 69fps against 144Hz is about 48 per cent of what the display can show. It is the lowest figure in the set and, unlike X-Plane 11, it is a straightforward statement about how much graphics work the machine can get through.
Sixty-nine frames per second is not a bad result. It is a perfectly playable, smooth experience, and anyone claiming otherwise has lost perspective. But it is the honest signal of direction. When the newest and heaviest title in the measured set produces the lowest number, that is not a coincidence - it is the trend. The games released over the life of this machine will look more like Doom: The Dark Ages than like Strange Brigade, and the sensible planning assumption is that the floor drifts downward from 69fps rather than holding there. Upscaling exists and will help, and it is worth remembering that every figure quoted here was taken with it switched off - so there is a real reserve available that these measurements deliberately do not draw on. But the raw trajectory is what it is.
Why the spread runs to 3.75x
Frame rate is a badly behaved unit for comparing things, and this table shows exactly why. It is a rate, so equal-sized differences in frames per second mean wildly different things depending on where on the scale they sit. Convert the results to frame times - the milliseconds each frame takes, which is what your eyes actually respond to - and the picture rearranges itself.
At 259fps a frame takes about 3.9 milliseconds (1000 divided by 259). At 158fps it takes about 6.3ms. At 108fps, about 9.3ms. At 69fps, about 14.5ms. So the 101fps gap between Strange Brigade and GTA V, which looks vast in frames per second, is about 2.4ms of frame time. The 39fps gap between Cyberpunk 2077 and Doom: The Dark Ages, which looks less than half as large in frames per second, is about 5.2ms - more than twice the change in what you would actually perceive.
This is the correct lens for the whole review. Differences at the top of the table are cheap and largely invisible; differences at the bottom are expensive and obvious. It also means that any headline average across a suite of games is dominated by results that matter least, which is a reason to look at the shape of the distribution rather than the mean. The scoring suite's 120fps average is a fair summary figure, and the panel would show about 83 per cent of it (120 divided by 144), but the lived experience of this machine is much better described by the group it lands in for the games you personally play.
As for where the 3.75x spread comes from, it is the ordinary arithmetic of workload variety. Strange Brigade is a well-optimised engine that has always run fast. GTA V is older. Dota 2 is light on graphics but constrained elsewhere. Cyberpunk 2077 and Doom: The Dark Ages are among the heaviest things you can point a GPU at. X-Plane 11 barely uses the GPU as its bottleneck at all. The machine is identical throughout; the jobs are not. That is the entire explanation, and it is why the phrase "gaming performance" needs a game attached to it before it means anything.
The 8GB frame buffer
The second constraining decision is the 8GB of VRAM, and it deserves a serious look without the hysteria that usually attaches to the subject.
The distinction to hold onto is that VRAM and shader throughput fail in completely different ways. If the GPU is short of processing power, you get fewer frames, and the game degrades gracefully - it runs at 70fps instead of 100fps, and it looks and feels the same, just slower. If the GPU runs out of memory, you do not get a smooth lower frame rate. You get stutter and texture pop: the system starts shuffling assets in and out of a buffer that is too small, textures load in late or at reduced quality, and the frame time graph develops spikes that are far more objectionable than a simple drop in average frame rate. A shortage of shader power is a dial. A shortage of memory is a cliff.
That asymmetry is why 8GB is the part of this specification most worth thinking about, even though the measured evidence gives it a clean bill of health. At 1920x1080 with High settings, 8GB is broadly adequate today. The measured figures demonstrate that the machine is not falling over: a set of results ranging from 69fps to 259fps with no obvious anomalies is what a system that is not running out of memory looks like. The relatively modest pixel count also helps directly, since frame buffers, depth buffers and post-processing targets all scale with resolution, and at 1080p those consume less than they would higher up.
But two caveats belong alongside that. First, the measurements were taken at 1080p High with upscaling off, which is not a configuration designed to stress a frame buffer. Higher texture settings, ray tracing, higher resolutions and heavier post-processing all push memory use up, and none of those conditions are represented in this data. What the numbers show is that 8GB is sufficient for the specific conditions measured - a narrower claim than "8GB is fine".
Second, and more importantly, the frame buffer is the specification's hardest ceiling over time. Shader performance ages gently - a GPU that produces 108fps in Cyberpunk 2077 today will produce a lower but still coherent number in a heavier game in two years. Memory capacity does not age gently, because game developers set their texture budgets against the hardware they expect to find, and when a title's requirements exceed what a card has, the failure is abrupt. You can usually reclaim the situation by lowering texture quality, and at 1080p on a 17.3in panel a step down in texture resolution is less visible than it would be on a denser display. But it is a compromise you will be making, and it is the compromise most likely to arrive first.
The practical guidance: at 1920x1080, which is the only resolution this machine's own panel offers, 8GB will do the job for the foreseeable near term. It is not a reason to avoid the machine for what it is. It is a reason to be sceptical of anyone planning to keep it for many years, and a strong reason not to plan on driving a higher-resolution external display with it.
What the measurements do not cover
Being clear about the boundaries of the data is part of the job. The measured set is a single resolution, a single preset, and one testing session. It contains no figures at any resolution above 1920x1080, so any claim about how this machine behaves at 2560x1440 or above - including on an external monitor - would be extrapolation, and we do not hold the numbers to support it. It contains no ray-traced results, no upscaled results, and no measurements of how the frame rates hold up over an extended session as the cooling system settles into a steady state. We hold no temperature, noise, battery-life or display-calibration figures for this machine, and this review will not invent any.
That last omission is worth flagging specifically in the context of a 95W power limit, because sustained load is precisely where power ceilings and cooling capacity express themselves most clearly. A benchmark run captures a machine's capability; it does not necessarily capture its behaviour an hour in. Where the data stops, the review stops.
The screen
A 17.3in 1920x1080 IPS panel at 144Hz
The display is a 17.3in IPS panel running 1920x1080 at 144Hz, and it is a set of choices that pull against each other in an interesting way.
Start with pixel density, because that is where the compromise lands. A 1920x1080 grid has a diagonal of about 2,203 pixels (the square root of 1920 squared plus 1080 squared, or the square root of 4,852,800). Spread that across a 17.3in diagonal and you get roughly 127 pixels per inch. That is low for a screen of this size. Individual pixels are physically larger than they would be with the same resolution on a smaller panel, and the practical effects are the ones you would expect: text and interface elements are less crisp than on a denser display, and jagged edges on high-contrast diagonal lines in games are more visible, which puts more weight on whatever anti-aliasing a given title provides. Anyone coming from a higher-resolution laptop or a modern phone will notice it immediately on the desktop, before they ever launch a game.
There is a real upside, and it is the reason the frame rates in the performance section look the way they do. The GPU only ever has to fill 2,073,600 pixels (1920 multiplied by 1080). That is a modest workload by current standards, and it is precisely why a 95W RTX 5070 with 8GB of memory produces a 120fps average across the scoring suite instead of struggling. Every one of the constraints discussed above - the power ceiling, the frame buffer - is made materially easier by the low pixel count. This is a coherent design, not a corner cut in isolation: the panel resolution is matched to what the graphics hardware can comfortably drive, and the machine is better balanced for it than a version with the same GPU behind a higher-resolution screen would be.
What actually reaches 144Hz
Being concrete about the refresh rate is more useful than repeating the number. Of the nine measured games, exactly two exceed 144fps: Strange Brigade at 259fps and GTA V at 158fps. One sits effectively level with it - F1 25 at 142fps, within 2fps of the cap. Everything else falls short, and the shortfall varies enormously.
- Over the cap: Strange Brigade (259fps), GTA V (158fps). The panel is the limit here, not the GPU.
- At the cap: F1 25 (142fps) - about 99 per cent of the refresh rate.
- Close underneath: Baldur's Gate 3 (130fps) and Dota 2 (128fps), at roughly 90 and 89 per cent of the panel's capability.
- Using most of it: Final Fantasy XV (123fps) at about 85 per cent, Cyberpunk 2077 (108fps) at about 75 per cent.
- Using about half: X-Plane 11 (74fps) at roughly 51 per cent and Doom: The Dark Ages (69fps) at roughly 48 per cent.
The honest summary is that the 144Hz panel is well matched to the lighter and mid-weight end of the measured set and considerably overspecified for the heavy end. In the demanding games this machine is bought for, roughly half the panel's refresh capability goes unused. That is not unusual - it is the normal state of affairs for any mid-range machine with a high-refresh screen - but it is worth stating plainly rather than letting "144Hz" do work it has not earned.
Why the high refresh rate still earns its place
None of that makes the 144Hz panel pointless below its cap, and the argument for it is worth spelling out because it is routinely misunderstood.
A display's refresh rate governs how often it can put a new image in front of you, and that has consequences even when the GPU is not supplying a new frame every single refresh. At 144Hz the screen refreshes roughly every 6.9 milliseconds (1000 divided by 144) rather than every 16.7ms at 60Hz, so a finished frame waits less time before it is shown. At 108fps in Cyberpunk 2077, the machine is producing a frame roughly every 9.3ms; a 144Hz panel gets those frames onto the glass far more promptly than a 60Hz one would, which reduces the total latency between your input and the visible result. There is a motion-clarity benefit too: a faster refresh means each image is held on screen for less time, which reduces the smearing your eye perceives when tracking a moving object.
So the panel is doing useful work at 69fps and at 108fps, not only at 259fps. The correct framing is that the high refresh rate is a latency and clarity feature that happens to also raise a frame rate cap, rather than a cap you should feel obliged to reach.
One thing we cannot tell you: whether the panel supports adaptive sync. Nothing in the data we hold confirms it either way, and it matters, because in the group of games running well below the refresh rate - which is most of them - adaptive sync is what prevents the mismatch between frame rate and refresh rate from producing tearing or judder. If you are choosing between this and something else, it is worth confirming directly with the retailer rather than assuming. We are not going to assume it here.
We also hold no brightness, contrast or colour-gamut measurements for this display, and there will be no figures invented for them. IPS as a panel technology gives you a reasonable expectation of stable viewing angles and consistent colour compared with cheaper alternatives, which on a screen this size genuinely matters - a 17.3in panel is wide enough that the edges are viewed at a noticeably different angle from the centre, and poor angle stability shows up as uneven brightness across the width. But that is a statement about the panel type, not a measurement of this specific unit.
Build, size and portability
What 2.698kg means in practice
At 2.698kg for the laptop alone, this is a machine that gets moved rather than carried. Add the power supply - and a 17.3in gaming laptop with a 95W graphics ceiling plus a Ryzen 7 260 needs a substantial one, though we hold no figure for its weight - and you are looking at a bag that you notice for the whole journey.
The useful way to think about a weight like this is by the shape of the day it fits into. Carrying it from a desk to a sofa, to a different room, to a friend's house for the evening: entirely reasonable, and the large screen is an asset once you arrive. Taking it on a train once a month: manageable, if not enjoyable. Carrying it daily as part of a commute alongside everything else you already carry: this is the wrong machine, and no amount of enthusiasm for the screen will change that after the first week.
The 17.3in chassis compounds the weight in ways the number alone does not convey. A 17.3in laptop has a physical footprint that many bags will not take at all, and that will not open fully on an aeroplane tray table or a cramped café table. Its size is a fixed constraint on where it can be used, independent of how heavy it is.
The compensations are real, though, and they are the reason to want a machine like this. A larger chassis has more internal volume for heatsinks, more surface area for exhaust, and more room between components. That is directly relevant to the power-limit discussion: a 95W ceiling in a 17.3in body is a considerably easier cooling problem than the same ceiling in a thin 14in one, and the practical effect tends to be a machine that holds its performance more comfortably and works its fans less hard to do it. We hold no thermal or acoustic measurements to confirm that for this specific model, so treat it as the physics rather than as a finding. But the physics is not in dispute.
The screen size is also the point of the machine, and it should not be undersold. Seventeen inches of display at a desk is a materially better experience than 15 or 14, particularly for the strategy and role-playing games where interface density matters - and Baldur's Gate 3 at 130fps is a good illustration of the kind of title that benefits from both the space and the frame rate. If you were going to plug a laptop into an external monitor anyway, a 17.3in panel is arguably a way to avoid needing to.
The battery
The battery is 76Wh. That is a respectable capacity for a machine of this class, and it is roughly what you would expect a 17.3in gaming laptop to carry.
We have no measured battery runtime for this machine, and there will be no estimate here, because runtime figures invented from capacity are worthless - they depend on screen brightness, refresh rate behaviour, which processor cores are active, whether the discrete GPU is engaged at all, and what the machine is being asked to do. What can be said without inventing anything is the structural point that applies to every gaming laptop: no machine with a discrete GPU at this tier plays games away from the mains for long, and a 76Wh cell does not change that. The battery's job on a machine like this is to cover the desk-to-desk gaps, light work and media, not a gaming session. Anyone buying a 17.3in, 2.698kg laptop with a 95W graphics ceiling and expecting meaningful unplugged gaming has misread the category rather than this particular product.
Memory and storage
Two specification lines deserve a comment because they shape the ownership experience more than their modest place on the sheet suggests.
16GB of memory is the current standard for a mid-range gaming machine and is sufficient for the games measured here. It is not generous. Between a modern operating system, a browser with a realistic number of tabs, a game launcher or three and a current title, 16GB is comfortably used rather than comfortably spare, and it is the kind of specification that tends to be the first thing an owner wishes were larger a couple of years in. Whether it can be increased later depends on whether the memory is socketed or soldered, and we hold no confirmation of that for this model - it is worth checking before purchase, because on a machine likely to be kept at a desk, upgradeability is more valuable than usual.
512GB of storage is the specification most likely to cause practical friction soonest. Current large games occupy a substantial fraction of a drive that size, and once the operating system has taken its share the working space left is modest. Two or three big installations and the drive is under pressure. This is not a performance problem and it is not a reason to reject the machine, because storage is the easiest and cheapest thing to add - but it is a near-certain future purchase rather than a hypothetical one, and it belongs in the budget from the start rather than arriving as a surprise. Again, we hold no confirmation of how many drive bays the chassis provides.
How it compares
This is where the review earns its keep, because the comparison data tells a story that is more interesting - and more useful - than the one the specification sheet sets up. Four rivals from the same GPU generation, each compared on the games both machines hold, preferring the scoring suite where possible. A note on the limits of the evidence before we start: for each rival we have their specification and the average frame rate difference across five shared games. We do not know which five games are shared in each case, and we do not hold per-game rival figures, so no individual rival result in any named title will appear below. Averages are all the evidence supports.
MSI Cyborg 15: the tier below, and the only price we can stand on
The MSI Cyborg 15 carries an RTX 5050 and sells for GBP 984. Across five shared games the Acer averages +31fps over it.
That result does two jobs, and the second is more important than the first.
The obvious job is establishing the gap to the tier below. Thirty-one frames per second, averaged across five games, is a substantial and unambiguous difference. For a sense of scale: it is larger than the 24fps gap between this machine's own scoring-suite average of 120fps and the 144Hz panel's ceiling. It is not the sort of margin that appears from run-to-run variation or from a favourable choice of titles, and it will be visible in play - not in every game equally, since the lighter titles will have compressed it and the heavier ones widened it, but on average, clearly.
The subtler and far more valuable job is that this result validates the measurement. It proves the test conditions have not flattened everything into a single indistinguishable heap. When a real tier gap exists in the silicon, this suite at this resolution finds it and reports it as a large number. Hold onto that, because it is the argument that makes the next section credible.
The GBP 984 figure also matters for a separate reason: it is the only confirmed price in the entire comparison set, and therefore the only hard value anchor available. We have no confirmed UK price for the Acer, so a direct value comparison cannot be made. But the shape of the question is clear regardless of what the Acer turns out to cost. A machine exists at GBP 984 that gives up an average of 31fps across five shared games. Whatever the Acer is quoted at, the buyer's job is to decide whether the difference between the two prices is worth that 31fps, along with the larger screen and the rest of the specification. That is a question you can answer at the checkout with a real number in front of you, and it is the right question to ask.
Razer Blade 14 and Schenker XMG Core 16 M25: two RTX 5070s, no measurable gap
Now the finding that makes this machine worth writing about at length.
The Razer Blade 14 runs the same RTX 5070, at 115W rather than 95W. Across five shared games, the average difference is nil. The Schenker XMG Core 16 M25 also runs an RTX 5070. Across five shared games, the average difference is also nil. Two independent machines, the same GPU, one of them with 21 per cent more graphics power available, and the benchmark data reports no average difference from either.
The tempting conclusion is that graphics power limits do not matter and that the whole subject is marketing noise. That conclusion is wrong, and it is worth being precise about why.
The correct reading is this: at 1920x1080 on the High preset with upscaling switched off, a substantial share of the shared titles are not limited by GPU throughput at all. They are limited by the processor, by the game engine's own internal ceilings, and by the per-frame overhead of moving work through the graphics pipeline. In those games, all three machines are waiting on the same class of bottleneck, and the GPU's power budget is irrelevant because the GPU is not the thing holding the frame rate down. Dota 2 landing at 128fps in this machine's own measured set is the visible fingerprint of exactly that effect.
Average a set of games together, and results like those act as ballast. Every CPU-limited or engine-limited title contributes a difference of near zero, and each one drags the average towards zero regardless of what happened in the genuinely GPU-bound titles. A real advantage in two heavy games gets diluted by three that could not express it. This is not a flaw in the testing - it is what happens when you measure a graphics difference under conditions where graphics is frequently not the constraint.
So what the data actually establishes is narrow and specific: under these conditions, across these shared titles, there is no measurable average difference between an RTX 5070 at 95W and an RTX 5070 at 115W. It does not establish that 95W and 115W are equivalent in general. The place where they would separate is sustained heavy load - long sessions in demanding titles where the power ceiling binds continuously and the cooling system's ability to hold clocks becomes the deciding factor - and higher resolutions, where the pixel count pushes the bottleneck decisively back onto the GPU and away from the processor.
We do not hold figures at any resolution above 1920x1080 for any machine in this comparison. That is a genuine gap, and it is the gap that would matter most if you intend to drive an external monitor at a higher resolution. Under those conditions, the Blade's extra 20W would be expected to show up. This data cannot tell you by how much, and neither will we.
One more honest caveat on the Blade specifically. By its name it belongs to a much smaller class of chassis than a 17.3in machine, and we hold no measurements of its size, weight, cooling or acoustics. A smaller machine running a higher power limit is doing a harder thermal job, and how well it sustains that is exactly the sort of thing this data does not capture. What the comparison establishes is that on the measured suite, the Acer keeps pace with it. That is a good result for the Acer and it is the extent of what can be claimed.
Why the two ties are findings rather than artefacts
This is the argument that ties the comparison section together, and it is worth making explicitly rather than leaving implied.
A reader looking at two consecutive zeroes is entitled to suspect the measurement rather than the machines. Perhaps the test is too easy. Perhaps every laptop is CPU-limited at 1080p and the whole exercise is measuring the processor. Perhaps the benchmark simply cannot tell any two gaming laptops apart.
The rest of the comparison set demolishes that suspicion. The same suite, at the same resolution, at the same preset, found a 31fps average gap over the RTX 5050 machine and an 81fps average gap to the RTX 5090 machine. A measurement that produces an 81fps difference on one comparison and a 31fps difference on another is manifestly capable of detecting real hardware differences. It is not saturated, it is not flattened, and it is not blind.
Therefore, when that same measurement reports nothing between three RTX 5070 machines, the honest interpretation is that there is nothing there to find at this test point - not that the instrument failed. The zeroes and the large numbers come from the same suite, and you cannot accept one and dismiss the other. Under these conditions, three RTX 5070 laptops with different power limits, different chassis and different manufacturers deliver the same average frame rate, and the differences between GPU tiers dwarf the differences within one.
That is a genuinely useful thing for a buyer to know, because it inverts the usual advice. The specification-sheet instinct is to hunt for the highest power limit available on a given GPU. On this evidence, at this resolution, that hunt is chasing something the measurements cannot see, while the choice that does show up clearly - which GPU tier you buy - is sitting right there in plain view.
Schenker XMG Neo 16 A25: the ceiling
The Schenker XMG Neo 16 A25 carries an RTX 5090. Across five shared games, this machine averages -81fps against it.
Eighty-one frames per second is an enormous average gap, and it is far outside anything that could be attributed to measurement variation, driver differences or a favourable selection of titles. For scale: the deficit alone is larger than two of this machine's own measured results - it is more than the 74fps X-Plane 11 figure and more than the 69fps Doom: The Dark Ages figure. Whatever the shared titles were, the Schenker is producing frames at a rate this machine is not remotely in contention for.
The lesson is unglamorous and worth stating plainly: this is a mid-range machine, and the money spent above it buys real, measured performance. There is a persistent line of argument that flagship gaming laptops are pure marketing and that mid-range hardware delivers most of the experience for a fraction of the outlay. On this evidence that argument does not survive contact with the data. The gap is not subtle, and it does not vanish into the averaging that swallowed the 5070-versus-5070 comparisons - which is itself informative, because it shows that when the difference is large enough, even a suite containing CPU-limited titles cannot hide it.
What this comparison does not license is any conclusion about power limits. We hold no figure for the Schenker's graphics power ceiling, and no part of the 81fps gap can be attributed to it. The difference between an RTX 5070 and an RTX 5090 is a difference of GPU tier - a fundamentally larger chip with more of everything - and that alone is a sufficient explanation. Attributing any of it to the 95W ceiling would be guessing with numbers we do not have.
Nor do we have a confirmed price for the Schenker, so nothing can be said about whether the performance is worth what it costs. What can be said is that the performance exists and is measured.
What the comparison set adds up to
Put the four rivals in a row and the practical conclusion is clean, and it is not the one the specification sheet invites.
The buyer's real decision is not "an RTX 5070 at 95W or an RTX 5070 at 115W". The benchmark data cannot tell those apart at this test point, and choosing between them on power limit alone means paying attention to a difference that did not show up in the measurements. The real decision is which GPU tier, and the tiers are separated by margins nobody could miss: 31fps down to the RTX 5050, 81fps up to the RTX 5090.
Within its own tier, this machine is competitive on the evidence available - it matches both RTX 5070 rivals on the measured average, one of which has more graphics power to work with. That is the finding. Whether it is the right RTX 5070 to buy then comes down to everything the frame rates do not cover: the 17.3in screen and whether you want a screen that size, the 2.698kg and whether that fits how you would use it, the 8GB frame buffer and how long you intend to keep it, and the price, which we do not have.
Why there is no score on this page
There is no overall rating for this configuration, and the reason is worth stating plainly because it is easily misread.
We have no confirmed UK price for the Acer Nitro v 17 (ANV17-41-R4CJ) in this exact specification. Value carries a large share of the weight in our scoring, and it cannot be computed without a price - a machine's performance is only meaningful relative to what it costs, and quoting a rating that ignored that would be quoting a rating for a different question than the one buyers are asking.
This is a gap in our data, not a fault in the machine. The benchmark suite is complete, the results are clean and internally consistent, and the machine ranks normally on the frame rate leaderboard against everything else we hold. Nothing about the measurements suggests a problem. We are simply missing one input, and we are not going to guess at it - a speculated price would produce a speculated rating, and a rating built on a made-up number is worse than no rating at all.
What this review can do is give you everything else, so that when you find a real price you can finish the calculation yourself. You know the measured frame rates. You know it averages 31fps more than a machine selling at GBP 984, matches two other RTX 5070 laptops, and gives up 81fps to an RTX 5090. That is enough to judge any price you are shown.
Who it's for
This machine suits a specific person well, and the specificity is a strength rather than a hedge.
Buy it if you want a large screen at a desk and steady frame rates in demanding games. The 17.3in panel is the reason to choose this over a smaller machine, and it is a genuine reason - for strategy games, role-playing games, simulators and anything with a dense interface, the extra display area is worth more day to day than a marginally higher frame rate would be. Baldur's Gate 3 at 130fps and F1 25 at 142fps are the sort of results that make a big screen enjoyable rather than merely large.
Buy it if 1920x1080 is genuinely where you intend to stay. This is the single condition that makes the whole design work. At this resolution the GPU has only 2,073,600 pixels to fill, the 8GB frame buffer has room, the 95W ceiling is not the constraint it would be higher up, and the measured results are the proof: a 120fps average across the scoring suite, with the heaviest game measured still at 69fps. Accept the resolution and this is a well-balanced machine. Fight it and every constraint on the sheet starts working against you at once.
Buy it if you want mid-range performance and are clear-eyed about what that means. The comparison data draws the boundaries honestly: comfortably ahead of the tier below, comfortably behind the tier above, and level with its peers. If that is the tier your budget lands in, this machine competes properly within it.
Buy it if the machine will mostly stay put. At 2.698kg with a 17.3in footprint, it moves between rooms and occasionally travels. The large chassis is an advantage for a machine that lives on a desk - more room for cooling, a bigger screen, and less of the compromise a thin design forces.
Who should buy something else
Anyone running above 1920x1080. If you intend to drive a 1440p or 4K external monitor, this is the wrong machine and the data cannot even tell you how wrong. We hold no measurements above 1080p, and every constraint on the sheet - the 95W ceiling, the 8GB frame buffer - becomes more binding as the pixel count rises. The panel is 1080p, so there is no in-built reason to go higher; if you plan to anyway, buy something specified for it.
Anyone planning to keep it five years and expect it to keep up. The 8GB frame buffer is the reason. Shader performance ages gently, but memory capacity does not, and when a future game exceeds the buffer you get stutter and texture pop rather than a graceful drop in frame rate. Doom: The Dark Ages at 69fps already shows the direction current releases are heading. This machine will still be running games in several years; it will be running them with the texture settings turned down, and for some buyers that is fine and for others it is not.
Anyone who genuinely carries a laptop. Not "moves it occasionally" - carries it, daily, in a bag, alongside everything else. At 2.698kg plus a power supply, in a 17.3in body that many bags will not accept and many tables will not accommodate, this is a machine you will resent within a fortnight. The category you want is a smaller and lighter one, and you will pay for the performance you keep.
Anyone buying the name rather than the configuration. "RTX 5070" sets an expectation, and a 95W implementation of it is not the fastest form that GPU takes. The comparison data happens to be kind here - it found no measurable average difference against a 115W version of the same chip - but that result is specific to 1080p High with upscaling off, and it should not be stretched into a general claim. If your expectations were set by a desktop card of the same name, or by benchmark figures from a much larger machine, calibrate them before you buy rather than after.
Anyone whose budget is genuinely tight. The MSI Cyborg 15 exists at GBP 984 and gives up an average of 31fps across five shared games. That is a real gap and this machine is meaningfully faster, but 31fps on top of frame rates that are already comfortable is a different kind of purchase from the difference between playable and not. If the money is better spent elsewhere, the tier below is not an embarrassment.
Anyone who needs storage headroom out of the box. 512GB fills quickly with current games. It is cheap to solve and not a reason to reject the machine, but it should be in the budget from day one rather than discovered in month three.
The bottom line
The Acer Nitro v 17 (ANV17-41-R4CJ) does the job it was designed to do. A 95W RTX 5070 with 8GB of memory, pointed at a 17.3in 1920x1080 144Hz panel, produces a 120fps average across the five scoring-suite games and never drops below 69fps in anything measured. Two of the nine games measured exceed the panel's refresh rate outright, three more sit within about 10 per cent of it, and the heaviest current release in the set still runs at nearly half the panel's capability with upscaling switched off - a reserve the measurements deliberately leave untouched.
The power limit is a real constraint, but it is a constraint that grows with the size of the job rather than a flat penalty, and because power scales super-linearly with clock speed it costs far less performance than the wattage difference suggests. The benchmark data goes further than that: against two other RTX 5070 machines, including one with 21 per cent more graphics power, it found no average difference at all. That finding is credible precisely because the same measurement found 31fps to the tier below and 81fps to the tier above. The instrument works; there was simply nothing to find within the tier.
The two things to think hardest about before buying are the 8GB frame buffer and the 17.3in chassis - one is the specification most likely to force compromises over time, the other is the specification that determines whether this machine fits your life at all. Neither is hidden, and both are entirely knowable in advance.
What we cannot tell you is whether it is good value, because we have no confirmed UK price for this configuration. The only price in the comparison set is the MSI Cyborg 15's GBP 984, and it gives up an average of 31fps across five shared games. Take that as your anchor, find a real quote for the Acer, and the decision becomes a straightforward piece of arithmetic that you are better placed to do than we are.