Performance analysis
The Division 2 (2019): what it takes to run it
Measured on 8 gaming laptops at 1920×1080, High preset, upscaling off.

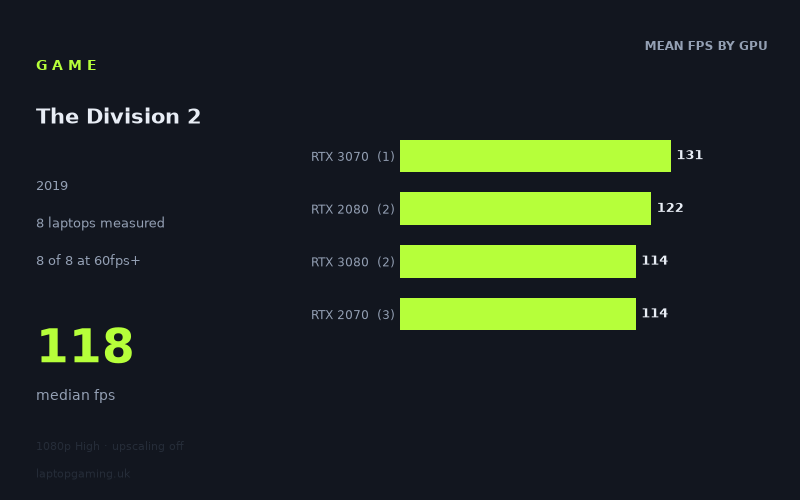
Every laptop we have figures for
Frame rates measured by Notebookcheck.
What it asks of a laptop
At 1,920 × 1,080 on the High preset with upscaling off, The Division 2 looks relatively forgiving for the eight gaming laptops in Notebookcheck’s measured sample. Every machine recorded more than 100fps, with results ranging from 105fps to 131fps. The median was 118fps.
That is a notably tight 26fps spread between the fastest and slowest result, especially given that the sample includes laptops fitted with RTX 2070, RTX 2080, RTX 3070 and RTX 3080 graphics. There is no result near 60fps, and no sign here that High settings at 1080p create a serious problem for these particular machines.
The more interesting point is that the GPU labels do not separate cleanly. The single RTX 3070 laptop was fastest at 131fps, matching the Asus Strix Scar 17 with an RTX 2080. However, the two RTX 3080 laptops delivered 123fps and 105fps, while the three RTX 2070 systems ranged from 105fps to 124fps. Notebookcheck’s numbers therefore suggest that laptop implementation matters substantially here: an RTX 3080 badge alone did not guarantee a higher frame rate than an RTX 2070 or RTX 2080 laptop in this test.
That does not mean the GPU is unimportant. Rather, this is a game and test scenario where the measured machines cluster closely enough that the wider laptop design appears to matter alongside the graphics chip. Buyers should be cautious about assuming that a nominally higher GPU tier will automatically deliver a proportionally higher result.
There is also a clear limit to the available data. These are figures from eight laptops, all tested at the same resolution and preset, and they cover only four GPU tiers. They show what these specific systems achieved; they do not establish how every laptop carrying one of these GPUs will perform.
What runs it
For a conventional 60Hz display target, all eight measured laptops are comfortably sufficient in this particular 1080p High test. Eight out of eight reached at least 60fps, and the slowest measured result was 105fps from both the Gigabyte Aero 15 OLED with RTX 2070 graphics and the Asus ROG Zephyrus G15 with RTX 3080 graphics.
The same is true for a 100fps target. All eight machines reached 100fps or more. This is useful for buyers considering a laptop with a display refresh rate above 60Hz: the measured results indicate that these systems can supply well beyond a basic 60fps experience at the stated settings.
- RTX 2070: Three laptops averaged 114fps. Individual results were 124fps for the MSI GE66 Raider, 113fps for the Gigabyte Aero 17 HDR XB, and 105fps for the Gigabyte Aero 15 OLED. All three cleared both 60fps and 100fps.
- RTX 2080: The two measured laptops averaged 122fps. The Asus Strix Scar 17 reached 131fps and the Acer Predator Triton 500 reached 112fps. Both were above 100fps.
- RTX 3070: Notebookcheck’s sample contains one RTX 3070 laptop, the Schenker XMG Neo 17 (Early 2021, RTX 3070, 5800H), at 131fps. That is an excellent figure, but it is still only one machine, so it should not be treated as an RTX 3070-wide guarantee.
- RTX 3080: The two measured systems averaged 114fps. The Gigabyte Aero 17 HDR YC reached 123fps, while the Asus ROG Zephyrus G15 reached 105fps. Both are over 100fps, but neither led the sample.
A 144fps target is different. None of the eight measured laptops reached 144fps. The fastest result was 131fps, achieved by the Asus Strix Scar 17 with RTX 2080 graphics and the Schenker XMG Neo 17 with RTX 3070 graphics. A 144Hz laptop display can still be useful with frame rates in this range, but the measured figures do not support a claim that these machines hold 144fps at 1080p High with upscaling disabled.
The cheapest laptop that handles it
No laptop prices are included in the supplied fact sheet, so it is not possible to identify the cheapest measured machine in GBP without inventing information.
What can be said from Notebookcheck’s figures is that the lowest recorded result came from two specific laptops: the Gigabyte Aero 15 OLED with RTX 2070 graphics and the Asus ROG Zephyrus G15 with RTX 3080 graphics, each at 105fps. The MSI GE66 Raider with RTX 2070 graphics was substantially quicker at 124fps, while the Gigabyte Aero 17 HDR XB with RTX 2070 graphics reached 113fps.
As a result, the cheapest suitable option cannot be inferred simply from the GPU tier. If choosing among used or discounted laptops, the individual model and its asking price matter more than assuming an RTX 3080 system is necessarily better value or faster for this game than an RTX 2070-equipped alternative.
What this means if you’re buying
If your aim is to play The Division 2 at 1080p High without upscaling, the measured figures are reassuring for the laptops listed here. Every one delivered at least 105fps, so a 60fps target is comfortably covered across the complete sample. Even a 100fps target was met by every measured machine.
For a buyer choosing between these GPU tiers, the evidence does not justify paying extra purely for the RTX 3080 name. The RTX 3080 average was 114fps, identical to the RTX 2070 average, while the two RTX 2080 laptops averaged 122fps and the sole RTX 3070 laptop reached 131fps. Those figures are not a general ranking of the GPUs; they are a reminder to compare the exact laptop rather than shop by graphics designation alone.
For high-refresh buyers, a 120Hz or similar display target is closer to what these results suggest than a firm 144fps expectation. Several machines were near or above 120fps, including the 131fps Asus Strix Scar 17, 131fps Schenker XMG Neo 17, 124fps MSI GE66 Raider and 123fps Gigabyte Aero 17 HDR YC. But none reached 144fps in the supplied test.
In short, the measured sample portrays The Division 2 as manageable rather than punishing on these gaming laptops at 1080p High. Prioritise the price, condition and overall specification of the exact machine you are considering, because Notebookcheck’s numbers show meaningful variation between laptops carrying ostensibly higher-tier graphics hardware.
How these numbers were produced
Frame rates here are not measured by us, and we label how each one was arrived at. A figure marked measured comes from a published run on that exact machine. A figure marked representative is derived from the GPU and its power limit (TGP) and cross-referenced against published reviews - a sound estimate of what that configuration delivers, but not a measurement of that specific laptop. Unless stated otherwise, numbers are 1920x1080, High preset, upscaling off. Where a laptop ships in several power configurations we use the wattage of the exact SKU listed, because a 140W RTX 5070 and a 115W one are not the same product.