Head-to-head
ASUS TUF Gaming A18 vs MSI Raider 16 Max HX
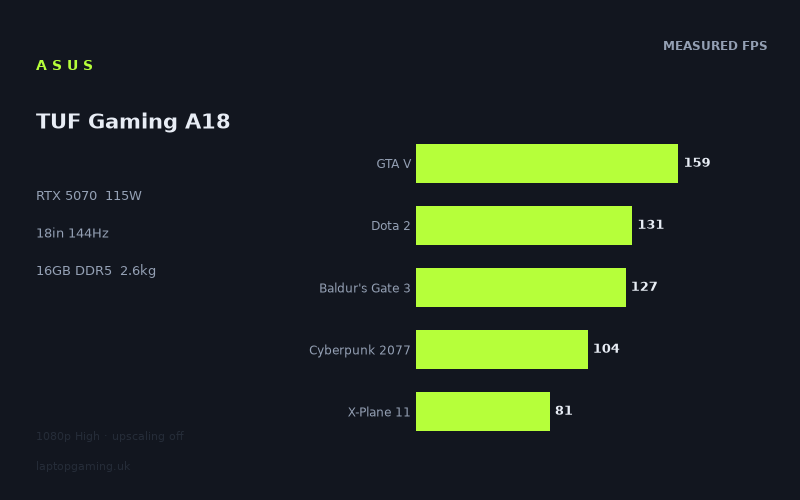
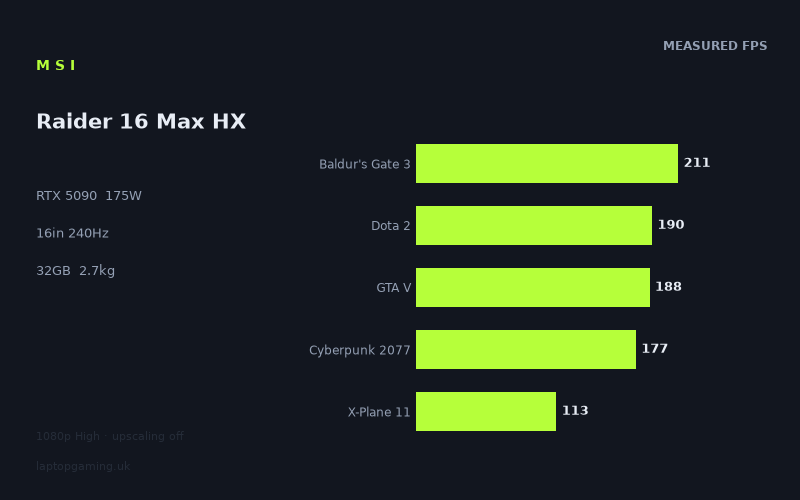
MSI Raider 16 Max HX is the faster machine, averaging 35% more frames across 8 games. We haven't confirmed a UK price for both machines, so treat this as a performance comparison rather than a value one.
Frame rates, side by side
| Game | ASUS TUF Gaming A18 | MSI Raider 16 Max HX | Diff |
|---|---|---|---|
| Assassin's Creed Shadows | 77 | 89 | -12 |
| Baldur's Gate 3 | 127 | 211 | -84 |
| Cyberpunk 2077 | 104 | 177 | -73 |
| Dota 2 | 131 | 190 | -59 |
| Final Fantasy XV | 123 | 205 | -82 |
| GTA V | 159 | 188 | -29 |
| Strange Brigade | 260 | 471 | -211 |
| X-Plane 11 | 81 | 113 | -32 |
1920×1080, High preset, upscaling off. Source: Notebookcheck.
Specifications
| ASUS TUF Gaming A18 | MSI Raider 16 Max HX | |
|---|---|---|
| Price | — | — |
| GPU | RTX 5070 | RTX 5090 |
| GPU power | 115W | 175W |
| CPU | Ryzen 7 260 | Core Ultra 9 290HX |
| Memory | 16GB DDR5 | 32GB |
| Display | 18in 1920x1200 | 16in 2560x1600 |
| Refresh | 144Hz | 240Hz |
| Weight | 2.6kg | 2.655kg |
| Score | Not scored - no UK price | Not scored - no UK price |
How these numbers were produced
Frame rates here are not measured by us, and we label how each one was arrived at. A figure marked measured comes from a published run on that exact machine. A figure marked representative is derived from the GPU and its power limit (TGP) and cross-referenced against published reviews - a sound estimate of what that configuration delivers, but not a measurement of that specific laptop. Unless stated otherwise, numbers are 1920x1080, High preset, upscaling off. Where a laptop ships in several power configurations we use the wattage of the exact SKU listed, because a 140W RTX 5070 and a 115W one are not the same product.
Read the full reviews
MSI Raider 16 Max HX
RTX 5090 · 175W · Core Ultra 9 290HX